This article will introduce how to build a powerful logging platform based on native Kibana and Clickhouse.
In the rapid development of business, the need to query and analyze various types of log data has caused a sharp increase in log storage scale. Traditional ELK and log systems based on ElasticSearch subsequently encounter many challenges in cost, stability, and performance. Increasingly, companies worldwide, such as Ctrip, Kuaishou, Bilibili, Cloudflare, and Uber, are switching their storage solutions to ClickHouse, experiencing significant benefits. Our log system has also begun migrating from ElasticSearch to ClickHouse, exploring and developing a comprehensive solution that fully caters to existing users' habits for a smooth transition.
1 Background Introduction
Since migrating from ElasticSearch to ClickHouse in 2020, our company's largest log system has experienced significant enhancements in cost-efficiency and stability. During the National Day period this year, it seamlessly managed over 500 billion logs daily, while reducing expenses to merely 30% of what was previously spent on the ElasticSearch solution.
In addition to this primary log system, our company operates several other logging systems, predominantly utilizing the open-source ELK stack. However, as these systems have scaled up, we've encountered escalating costs and stability challenges. Consequently, we are planning to transition the storage foundation of all logging systems to Clickhouse.
The industry has broadly discussed and shared insights on selecting and using Clickhouse for logging scenarios. However, this article will not focus on those details. For those interested, we encourage you to conduct your own research to find more in-depth information.
After switching to Clickhouse for log storage, the primary concern becomes enhancing the query UI user experience. Although many companies have developed custom query UIs after migrating to Clickhouse, ensuring a smooth transition that respects users' familiar habits from Kibana poses a significant challenge. This necessitates users to learn new syntax and UI interactions, inadvertently leading to substantial costs.
Thus, enabling users to transition to a new platform without incurring any learning costs is a particularly challenging issue.
2 Solution Introduction
Our approach is actually quite simple and intuitive. We decided to insert an extra proxy layer between native Kibana and Elasticsearch. This proxy is responsible for the syntax translation between Elasticsearch and ClickHouse:
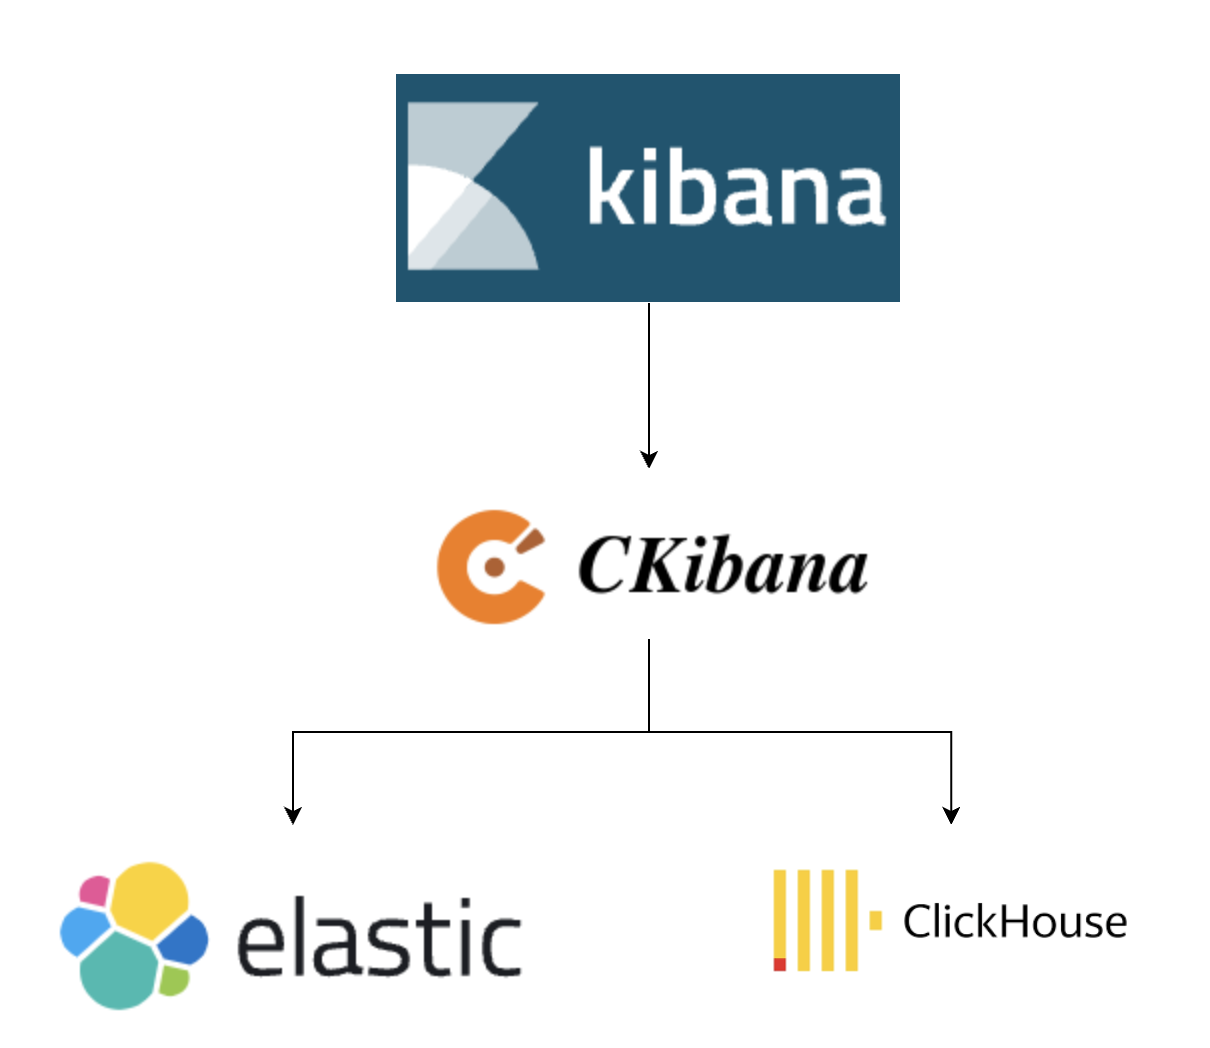
We developed our own Proxy (dubbed CKibana), which translates chart requests into ClickHouse syntax, fetches results from ClickHouse, and then simulates an Elasticsearch response to return to Kibana. This allows us to directly display data from ClickHouse in the native Kibana interface. Beyond syntax translation, we also tackled many real-world challenges.
Considering the limitations of ClickHouse's query concurrency capabilities, we retained Elasticsearch. This Elasticsearch can be used for advanced features such as result caching and storing metadata related to Kibana, and it is very lightweight.
3 How to Use CKibana
Components
- Kibana: Used to provide a UI display for business purposes.
- ElasticSearch: Used for storing Kibana metadata and for query caching among other advanced features.
- ClickHouse: The storage system where the actual log data is stored.
- CKibana: Provides Proxy and other advanced functionalities, enabling users to query ClickHouse data directly on the native Kibana.
Getting Started
Launching CKibana
To start using CKibana, you'll first need to configure it with the necessary Elasticsearch details.
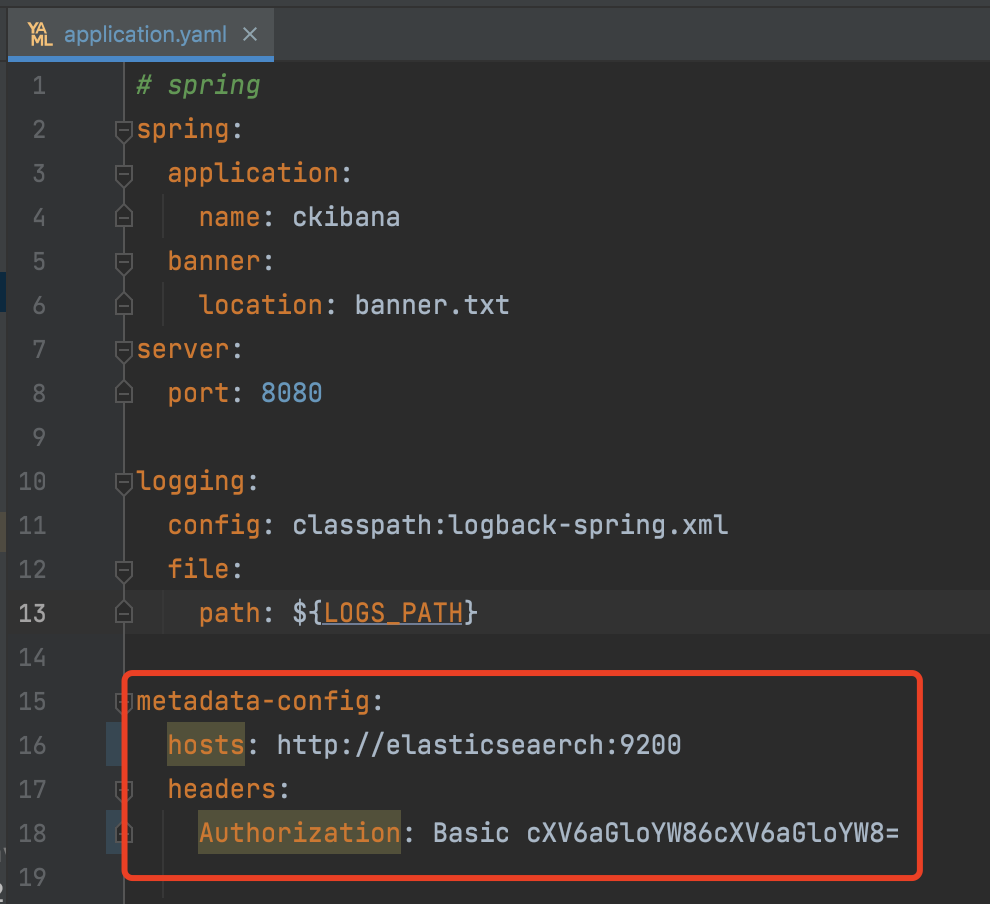
Once you have your configuration set up, ensure that you have JDK 17 or higher installed on your system for CKibana to run. You can then launch CKibana with the following command:
java -jar ckibana.jar
Kibana Configuration
To modify the Kibana configuration, change the Elasticsearch address to the CKibana address:
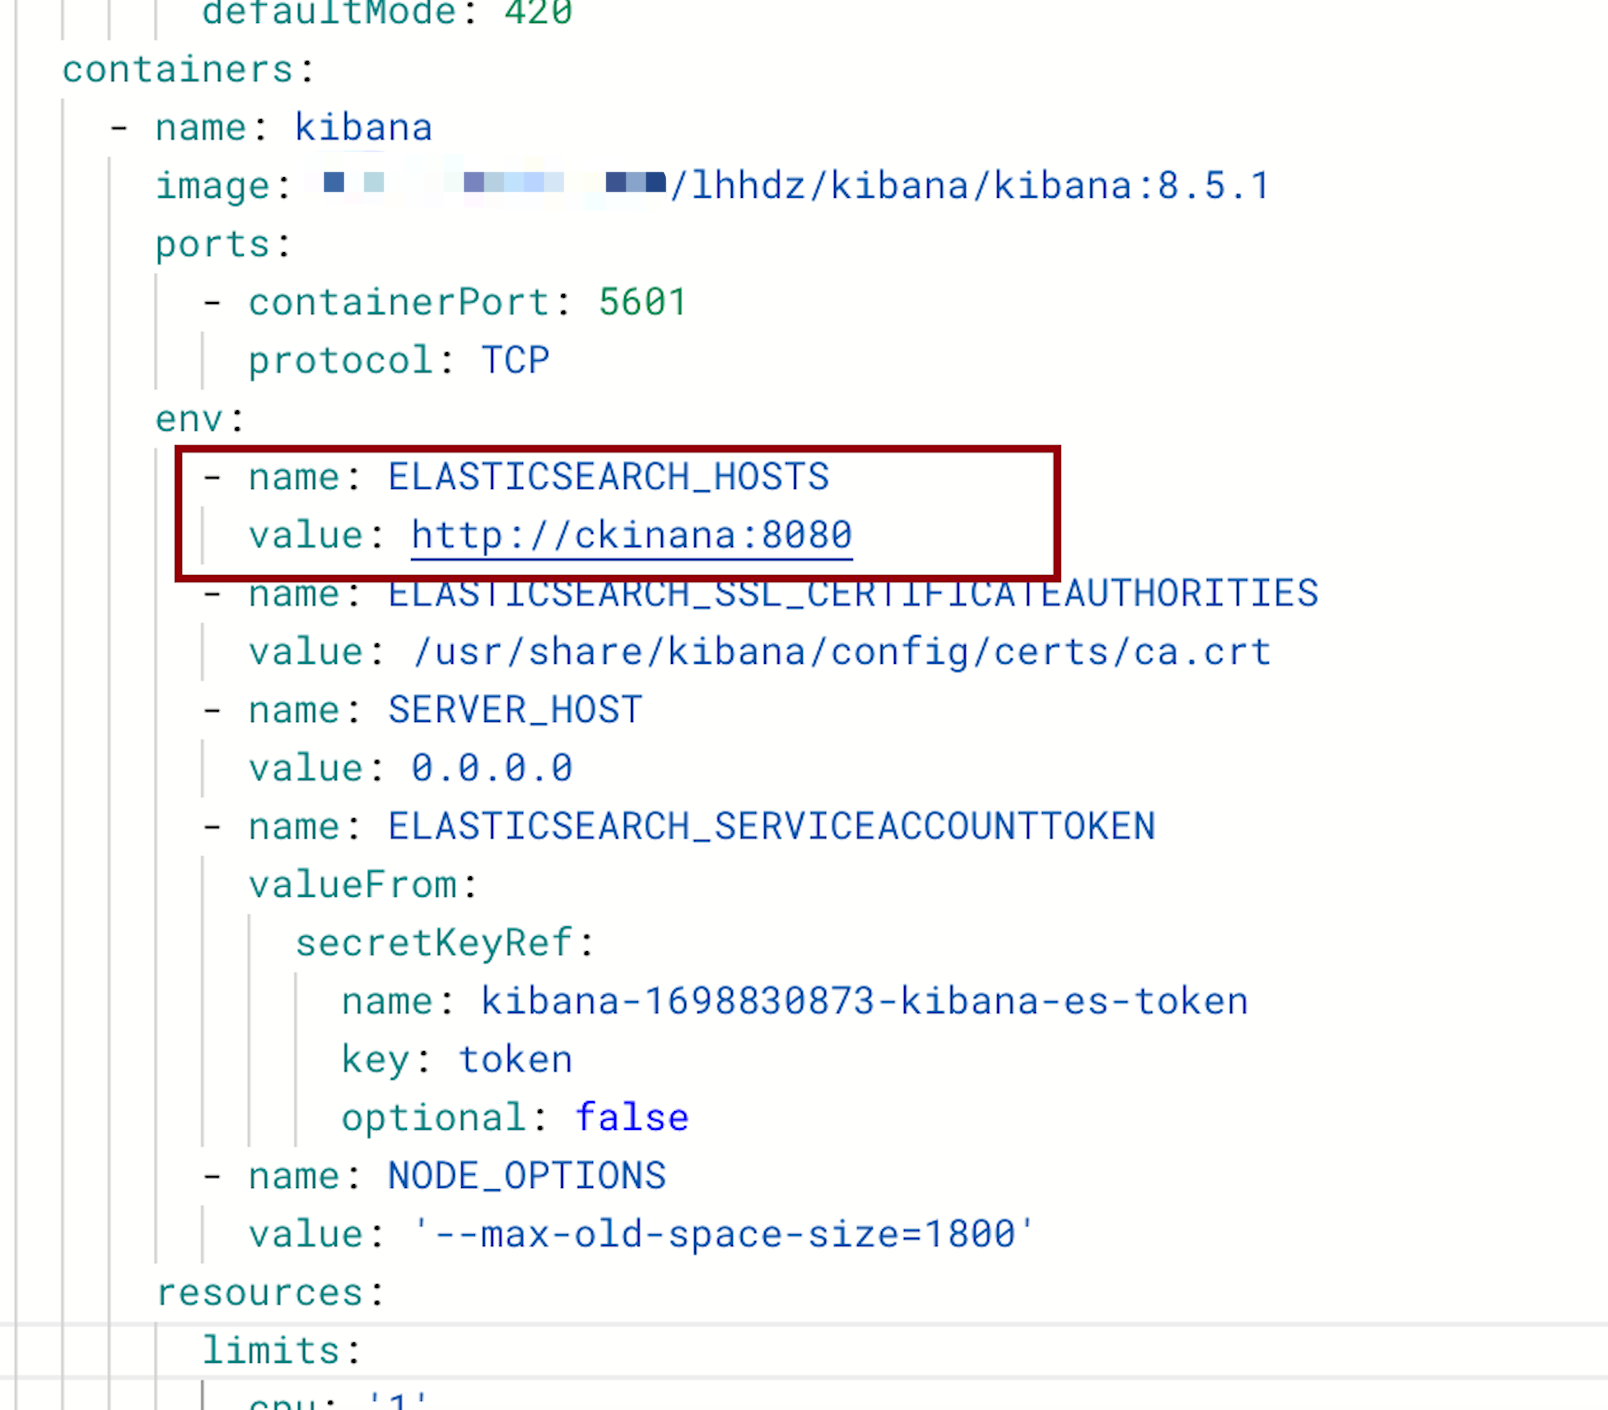
At this point, Kibana is fully functional and can use CKibana as an Elasticsearch Proxy:
Configuring ClickHouse Connection Information and Index Whitelist
Set up the ClickHouse connection:
curl --location --request POST 'localhost:8080/config/updateCk?url=ckUrl&user=default&pass=default&defaultCkDatabase=ops'
Configure the index to switch to ClickHouse
curl --location --request POST 'localhost:8080/config/updateWhiteIndexList?list=index1,index2'
The corresponding relationship between field types in ElasticSearch and ClickHouse is as follows:
Create index pattern
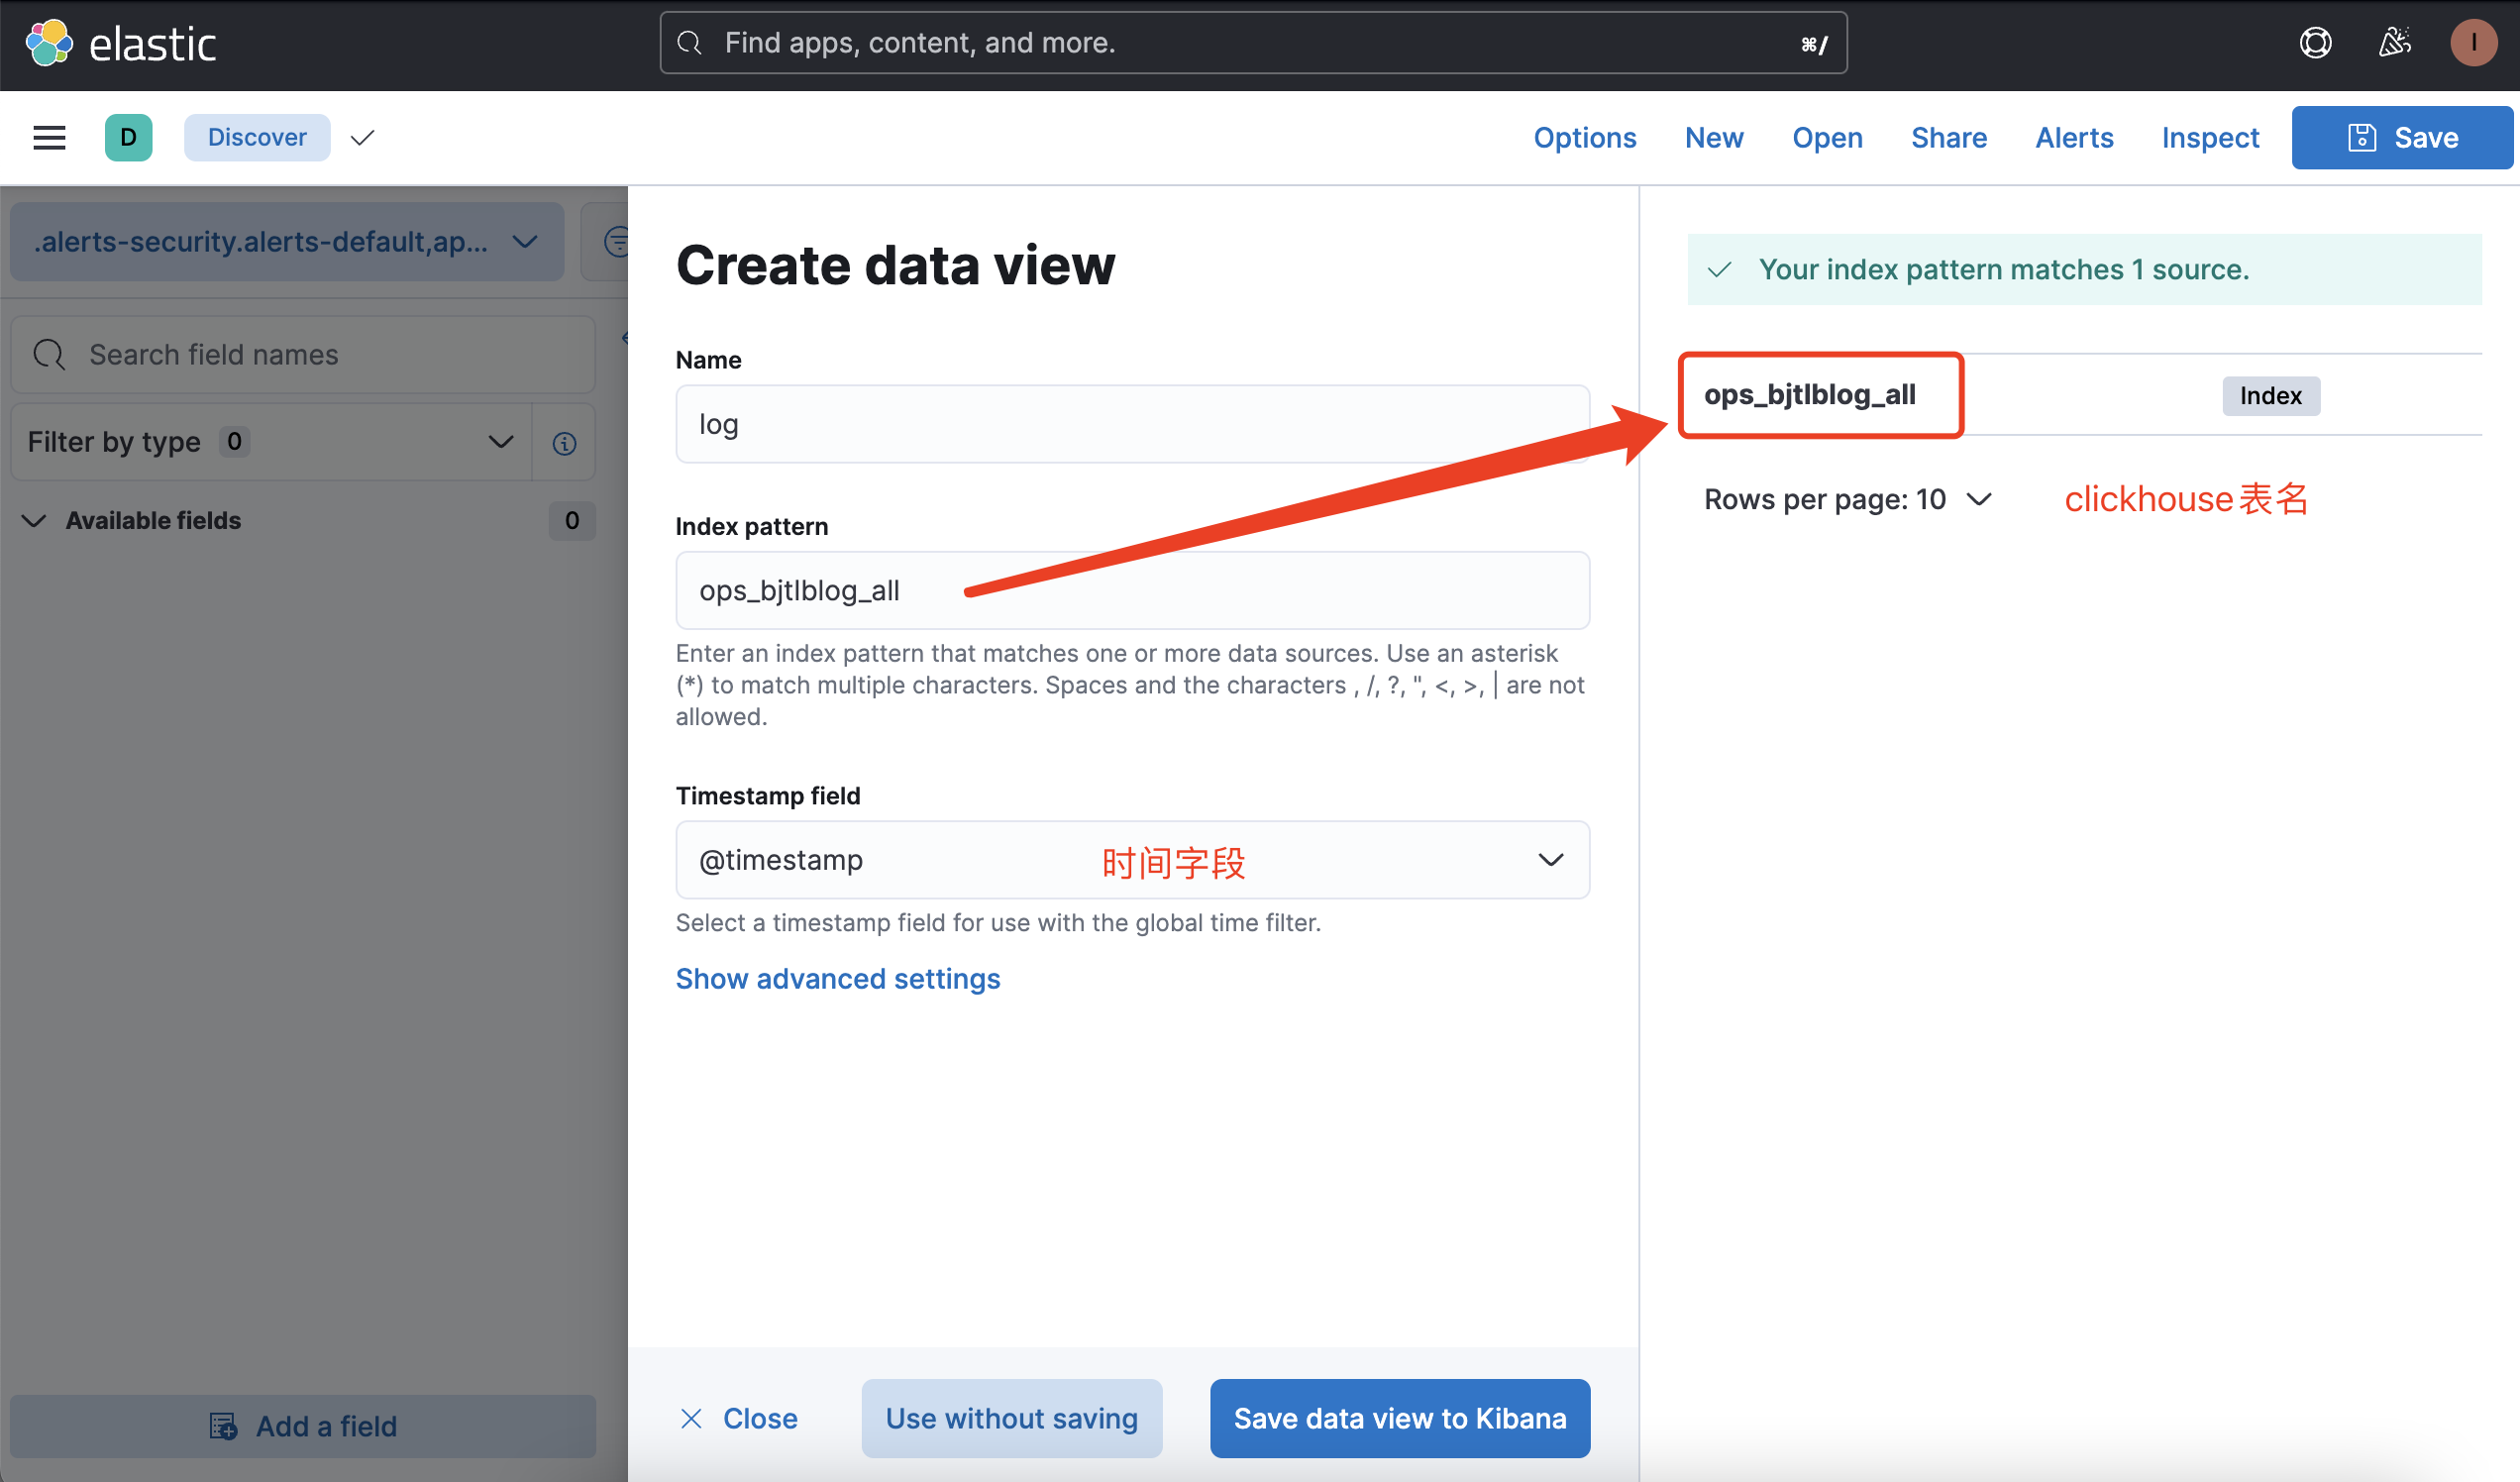
Key Points to Note:
- First, ensure that the input index pattern matches the ClickHouse table exactly; the index pattern and the ClickHouse table name must be an exact match.
- If the corresponding table cannot be selected, you can troubleshoot based on the SQL in the CKibana logs to see if the corresponding table can be queried.
- Pay attention to the time field; otherwise, the time field will not be selectable. The selection logic is as follows:
- Fields of the Date type, such as DateTime64, will be considered as time types.
- Field names containing "time", for example (@timestamp UInt64), will be considered as time types.
In either of these two cases, if any one condition is met, the field will be considered a time field. If you are unable to select a time field, it's necessary to check whether the fields in the ClickHouse table comply with the matching logic.
Here we go
After configuring the index pattern, you can now make full use of Kibana's visual analysis capabilities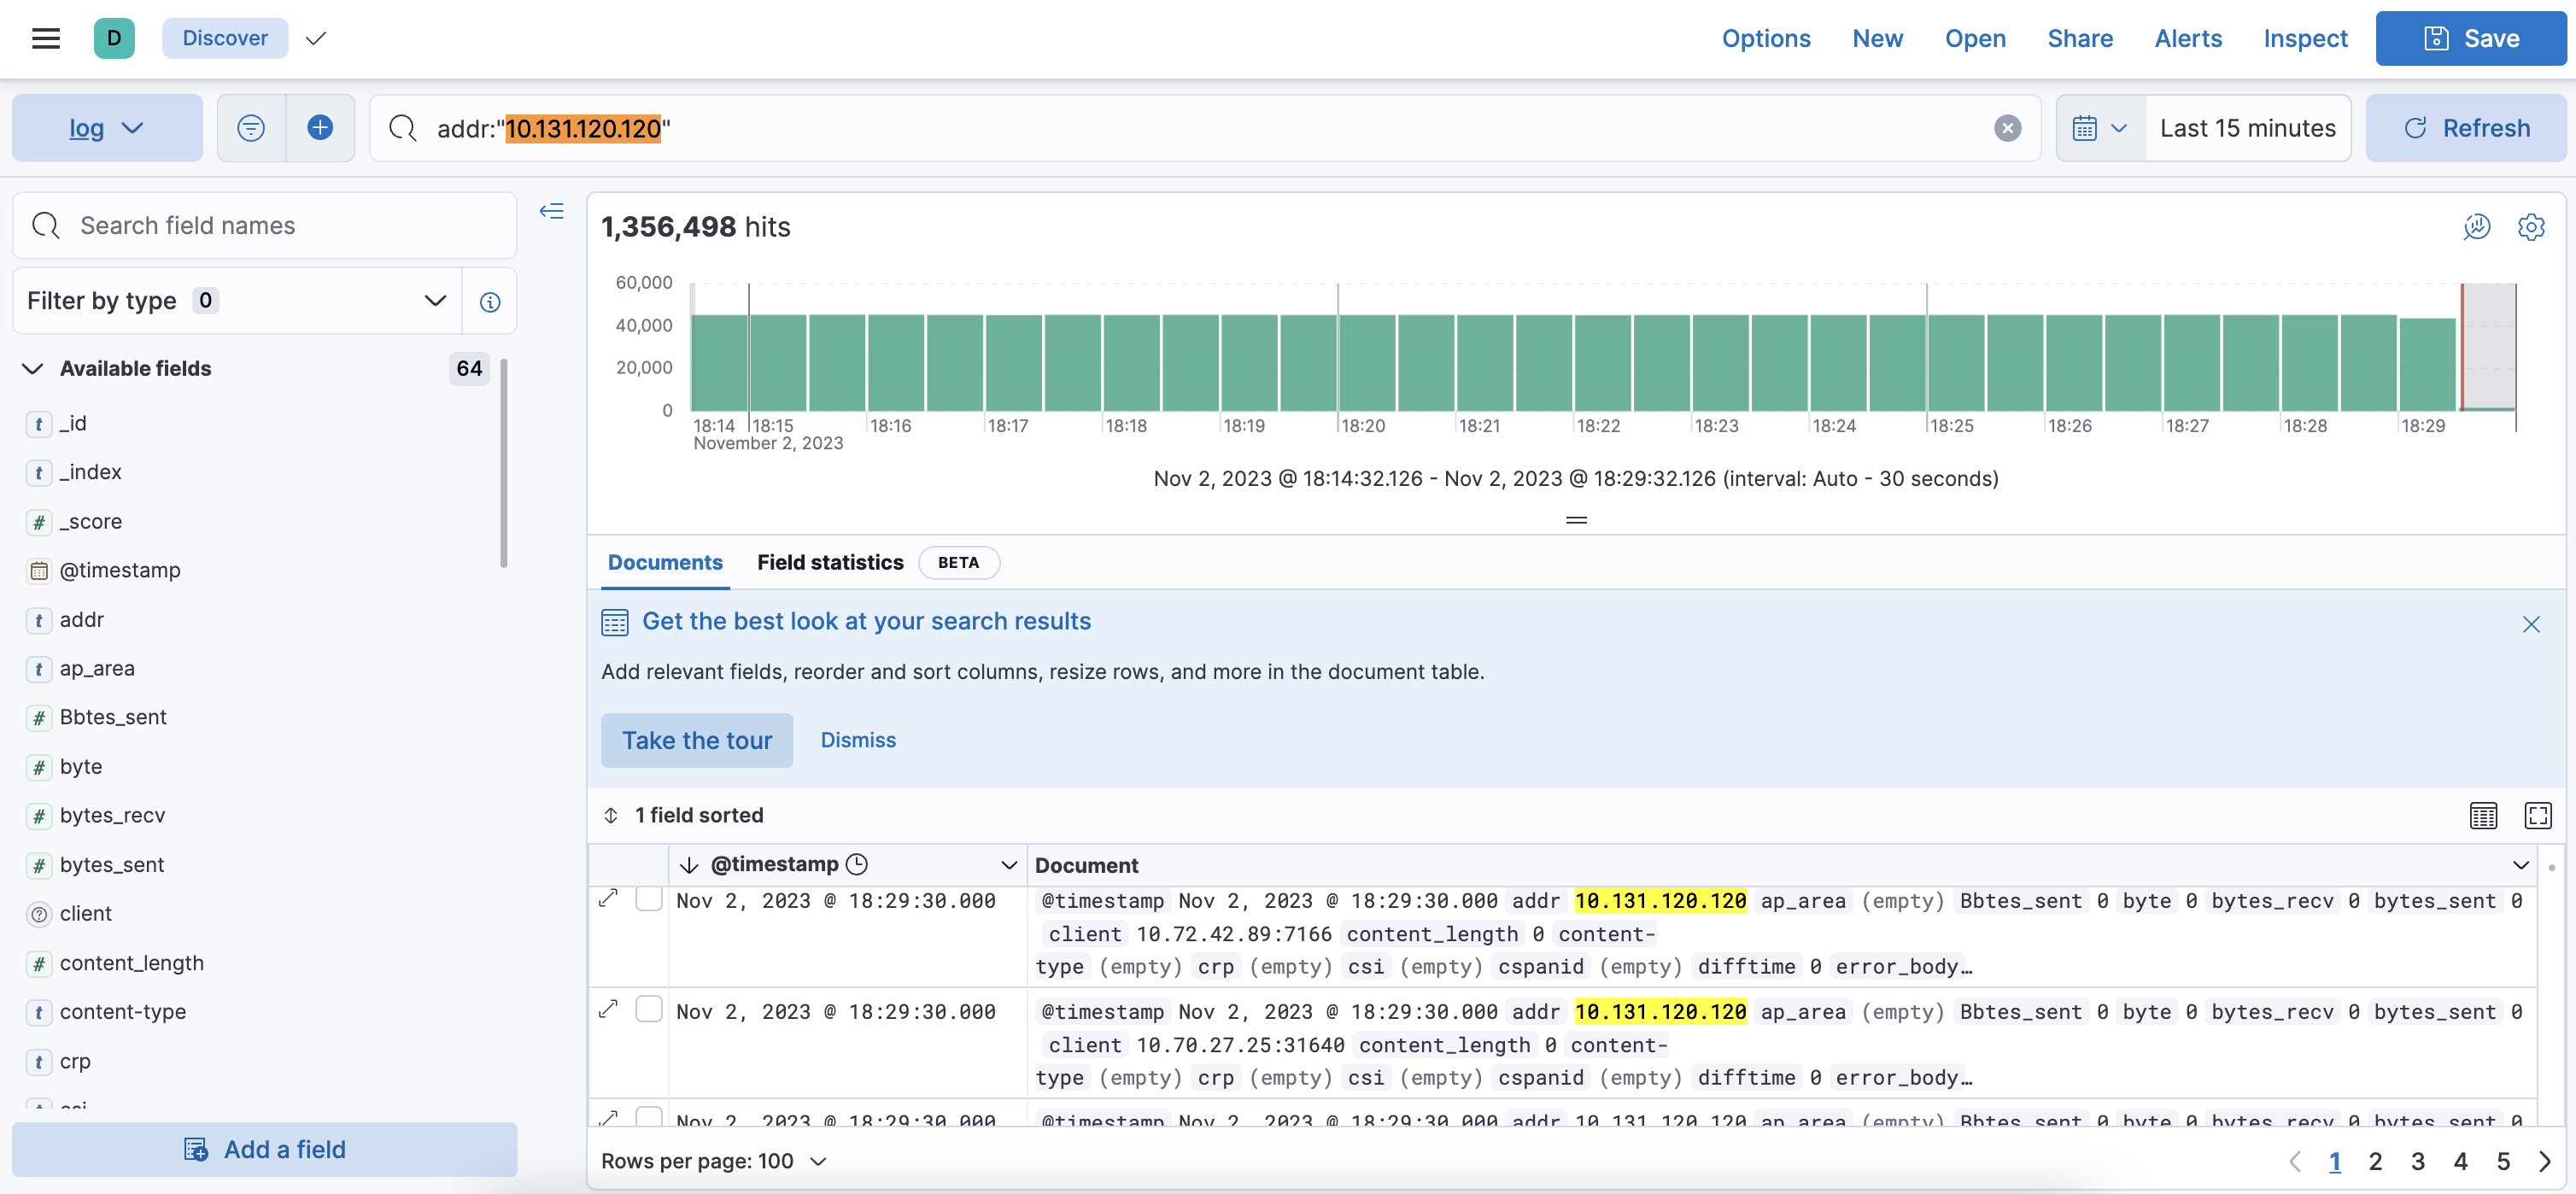
Advanced Features
Sampling
Most of Kibana's charts focus on trends. When the result set is too large, it consumes more ClickHouse resources. We provide a sampling feature that ensures the chart trends are close to actual trends while effectively controlling the use of ClickHouse resources, especially when dealing with large datasets.
Note:
- The corresponding ClickHouse table needs to be created according to the ck sampling table requirements.clickhouse sample
- If the sampling threshold is set too low, it can result in a significant difference between the reconstructed values and the true values. We have set our online sampling threshold to 5 million.
Enabling sampling requires two steps:
- Configure the tables to be sampled.
- Update the sampling threshold. Sampling is triggered when the result set exceeds this threshold.
Sampling logic: Math.max(0.01, Double.parseDouble(String.format("%.5f", sampleParam.getSampleCountMaxThreshold() * 1.00 / sampleParam.getSampleTotalCount())))
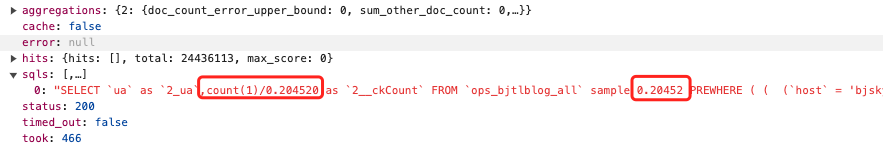
Expanding the response from the rate limiter, you can see the sampling value.
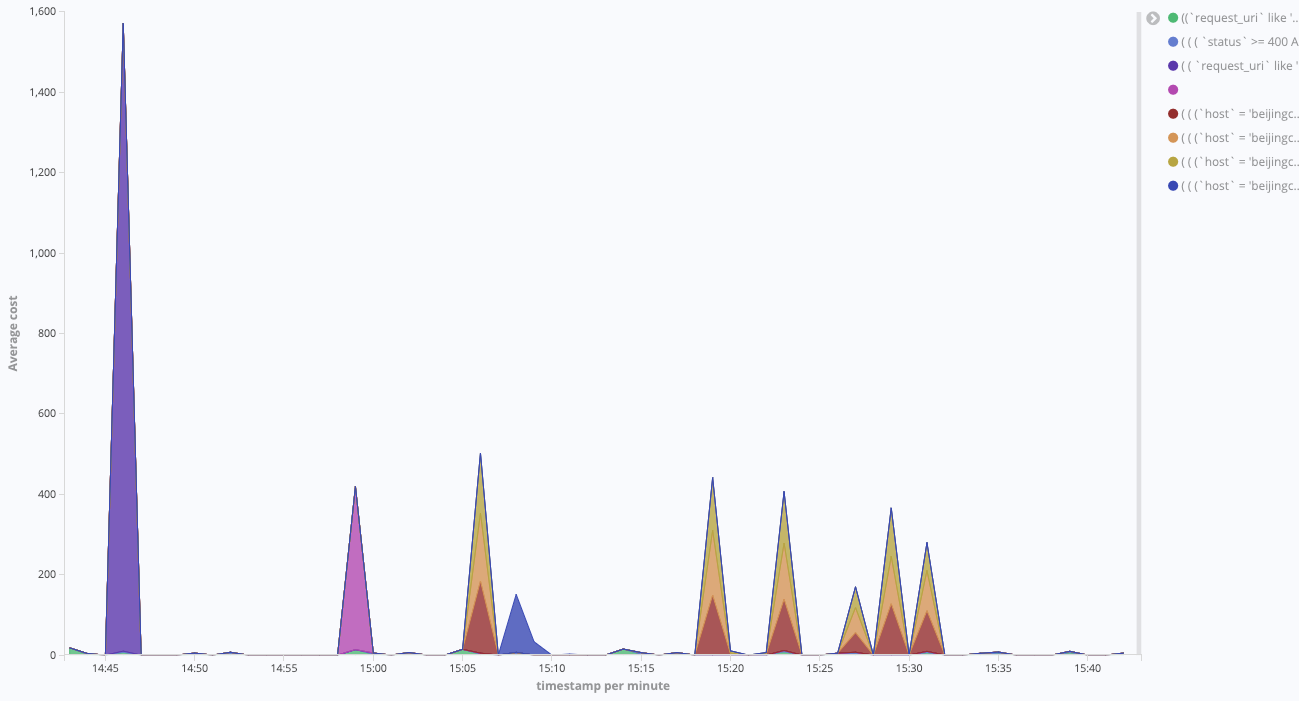
Time Rounding + Caching
When an issue occurs online, a large number of SRE and business colleagues need to query the nginx logs for troubleshooting, and their query conditions are mostly the same. However, ClickHouse aims to achieve the best query performance by utilizing as many CPUs as possible for computations. This situation leads to ClickHouse's CPU usage spiking to full capacity. Moreover, under continuous retries by colleagues, the CPU cannot recover.
Therefore, we implemented a feature for time rounding + caching.
Time Rounding: For instance, setting rounding to 20s means that the second's precision in the query time conditions will be %20, effectively introducing a maximum delay of 20s for data queries.With time rounding in place, a large number of query conditions become identical. At this point, enabling result caching can significantly alleviate the pressure on ClickHouse.
Set up time rounding:
curl --location --request POST 'localhost:8080/config/updateRoundAbleMinPeriod?roundAbleMinPeriod=20000' 单位ms
Enable caching:
curl --location --request POST 'localhost:8080/config/updateUseCache?useCache=true'
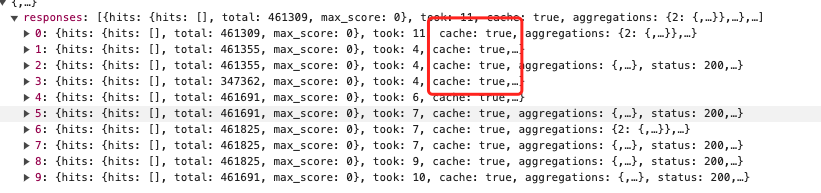
Whether the cache is hit can be seen in the response structure.
Query Monitoring + Blacklisting
Kibana's query syntax is relatively flexible, but some queries can consume substantial resources from ClickHouse. Therefore, we have implemented monitoring for all queries and their execution times. This allows us to easily view which queries have been performed and set up blacklisting controls for them. By doing this, we can restrict queries that are not very efficient.
Enable monitoring:
curl --location --request POST 'localhost:8080/config/updateEnableMonitoring?enableMonitoring=true'
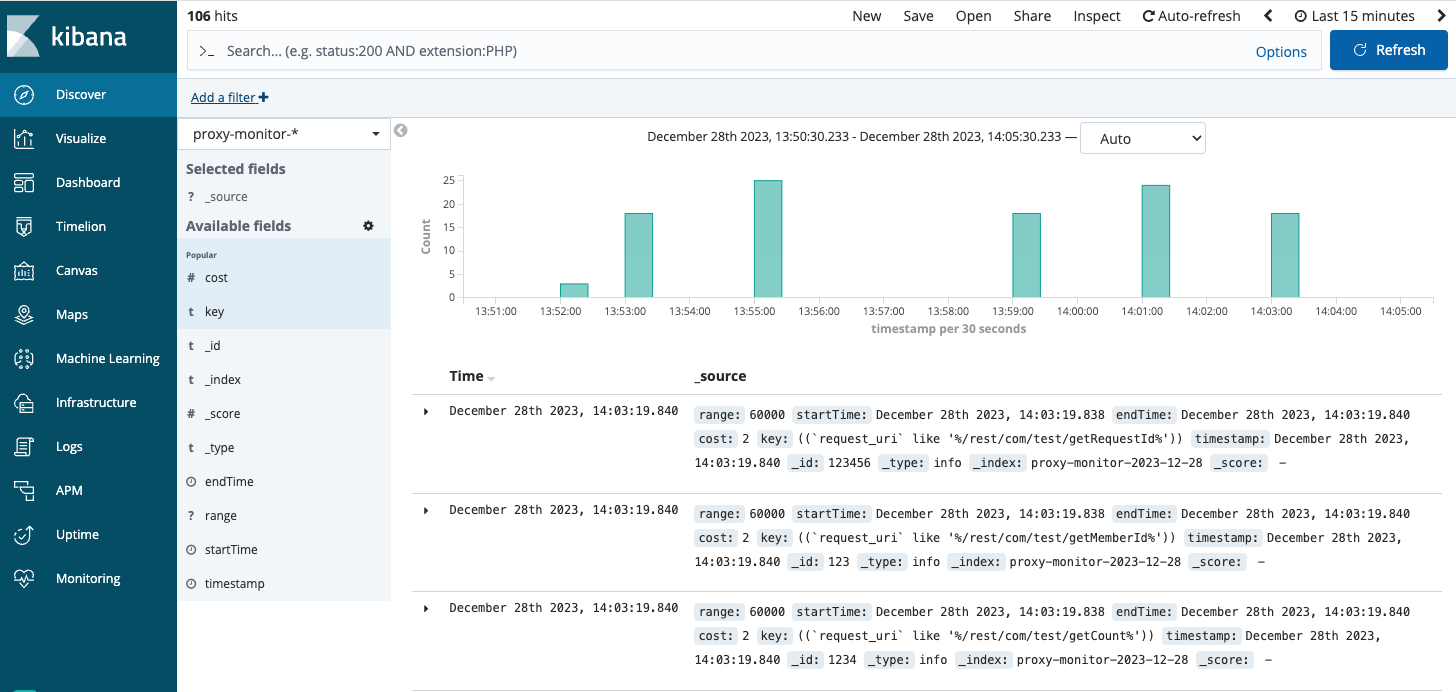
As shown in the figure above, we can monitor the details, syntax, and execution time of each query.
This allows us to leverage Kibana's powerful built-in chart features for more intuitive analysis.
Query TimeRange Limits
Often, when users want to view the latest trends based on certain conditions, they might directly query data for recent periods, such as the last 7 days. This can lead to significant resource consumption. To manage this, CKibana has implemented a maximum time range for queries, which helps in limiting usage and conserving resources.
curl --location --request POST 'localhost:8080/config/updateMaxTimeRange?maxTimeRange=864000000' 单位ms
keyword Query
To better align with ElasticSearch usage conventions, a field.keyword query is equivalent to an exact search on the field, whereas without .keyword it implies a fuzzy search.
For example, host.keyword:"www.baidu.com" when translated into SQL becomes:host="www.baidu.com".
Discover Performance Optimization
ClickHouse is highly suitable for analytical processing (AP) scenarios, particularly when large time spans are involved in queries. Traditional SQL commands like select x from table where x order by time desc limit 10 can lead to very low query performance and consume a significant amount of ClickHouse resources.
To address scenarios that involve trend graphs plus details, we have optimized performance to fully leverage ClickHouse's AP capabilities. This optimization involves splitting the execution into two steps:
- Leveraging ClickHouse's aggregation capabilities to query the number of logs that meet the criteria per minute.
- Based on the number of logs per minute, automatically trimming the log search time span. For instance, if the number of logs within a minute fulfills the requirement, then the query detail time span is automatically reduced to one minute.
This feature of automatically trimming the query time leads to a significant improvement in the query performance of the Discover version and greatly optimizes CPU usage in ClickHouse.
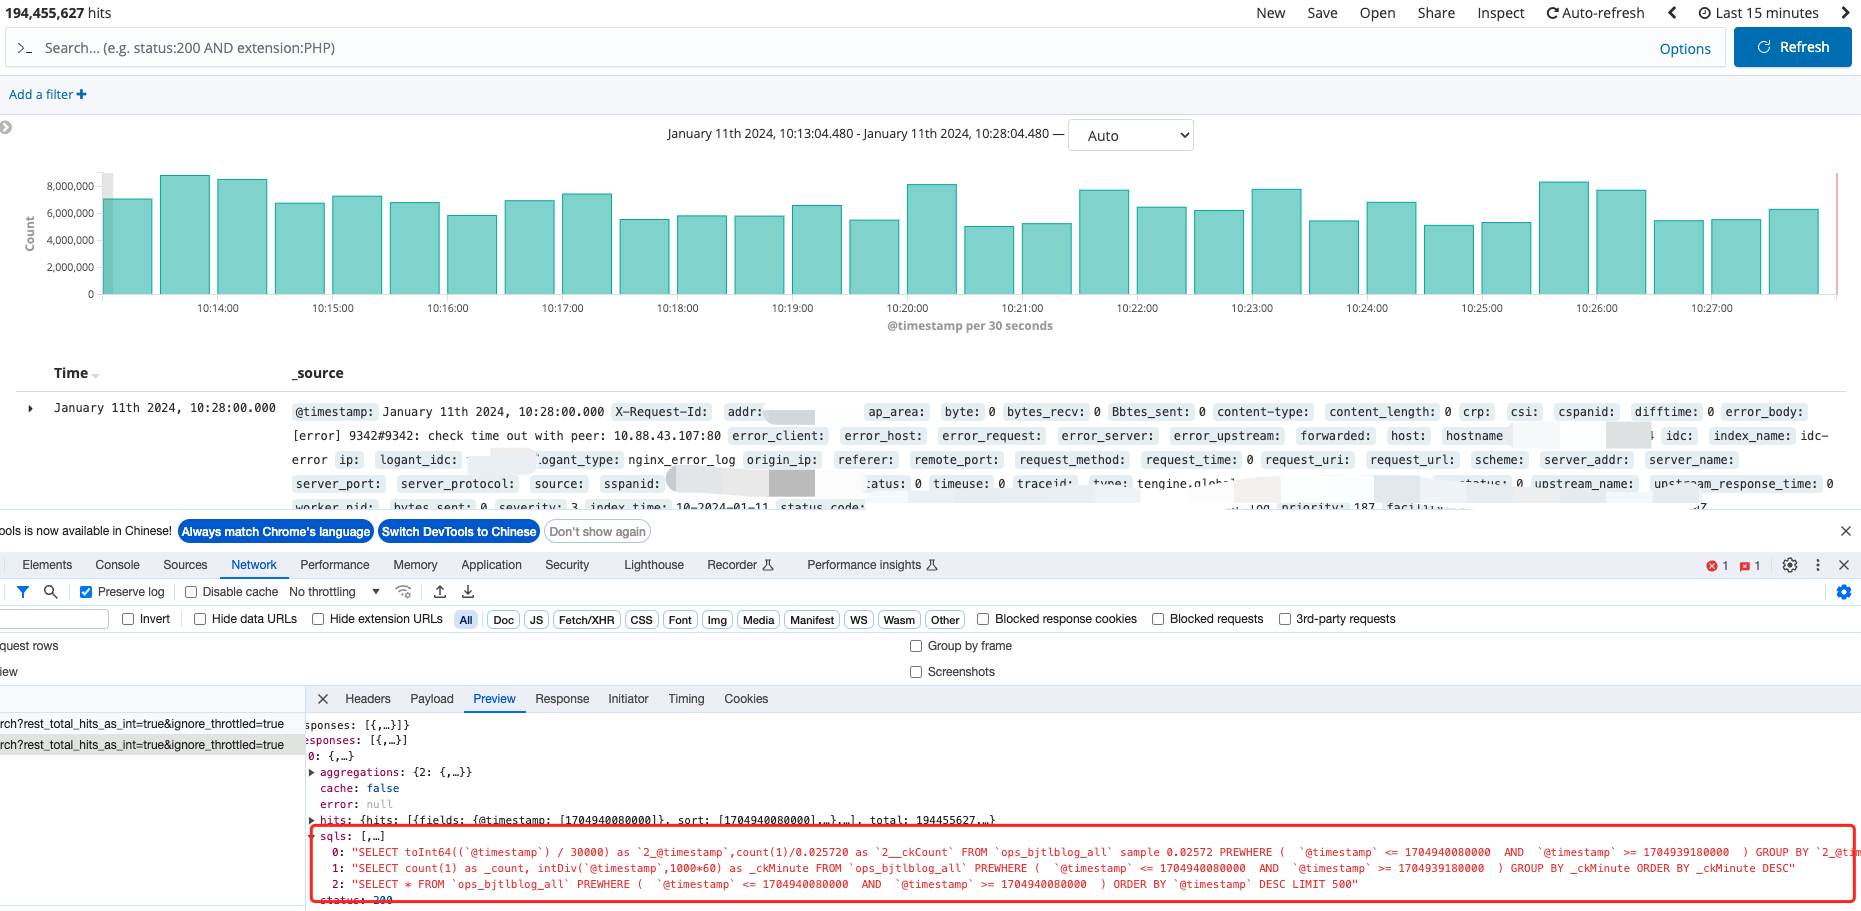
As illustrated above, a Discover query is divided into three SQL statements:
- Determine whether sampling is needed
- Count the number of logs per minute
- Automatically trim the query time range
4 Usage scenarios: Nginx logs
Clickhouse Table
(
`@timestamp` UInt64,
`X-Request-Id` String,
`addr` String,
`ap_area` String,
`byte` Int64,
`bytes_recv` Int64,
`Bbtes_sent` Int64,
`content-type` String,
`content_length` Int64,
`crp` String,
`csi` String,
`cspanid` String,
`difftime` Int32,
`error_body` String,
`error_client` String,
`error_host` String,
`error_request` String,
`error_server` String,
`error_upstream` String,
`forwarded` String,
`host` String,
`hostname` String,
`idc` LowCardinality(String),
`index_name` LowCardinality(String),
`ip` String,
`logant_idc` LowCardinality(String),
`logant_type` LowCardinality(String),
`origin_ip` String,
`referer` String,
`remote_port` String,
`request_method` LowCardinality(String),
`request_time` Int64,
`request_uri` String,
`request_url` String,
`scheme` String,
`server_addr` String,
`server_name` String,
`server_port` String,
`server_protocol` String,
`source` String,
`sspanid` String,
`st` String,
`status` Int32,
`timeuse` Float64,
`traceid` String,
`type` String,
`ua` String,
`up_addr` String,
`up_status` Int32,
`upstream_name` String,
`upstream_response_time` Int32,
`worker_pid` String,
`ck_assembly_extension` String,
`bytes_sent` Int64,
INDEX timestamp_index `@timestamp` TYPE minmax GRANULARITY 8192
)
ENGINE = MergeTree
PARTITION BY (toYYYYMMDD(toDateTime(`@timestamp` / 1000, 'Asia/Shanghai')), toHour(toDateTime(`@timestamp` / 1000, 'Asia/Shanghai')))
ORDER BY (host, request_uri, intHash64(`@timestamp`))
SAMPLE BY intHash64(`@timestamp`)
SETTINGS in_memory_parts_enable_wal = 0, index_granularity = 8192
Always place host at the first position in the ORDER BY clause, as most Nginx log queries require sorting based on the host.
CKibana Configuration
{
    "Proxy": {
        "ck": {
            "url": "ip:6321",
            "user": "user",
            "pass": "pass",
            "defaultCkDatabase": "db"
        },
        "es": {
            "host": "ip:31940"
        },
        "roundAbleMinPeriod": 120000,
        "round": 20000,
        "maxTimeRange": 86400000,
        "blackIndexList": null,
        "whiteIndexList": ["ops_bjtlblog_all", "other_index_all"],
        "enableMonitoring": true
    },
    "query": {
        "sampleIndexPatterns": ["ops_bjtlblog_all"],
        "sampleCountMaxThreshold": 5000000,
        "useCache": true,
        "maxResultRow": 30000
    },
    "threadPool": {
        "msearchProperty": {
            "coreSize": 4,
            "queueSize": 10000
        },
        "commonProperty": {
            "coreSize": 4,
            "queueSize": 10000
        }
    },
    "defaultShard": 2
}
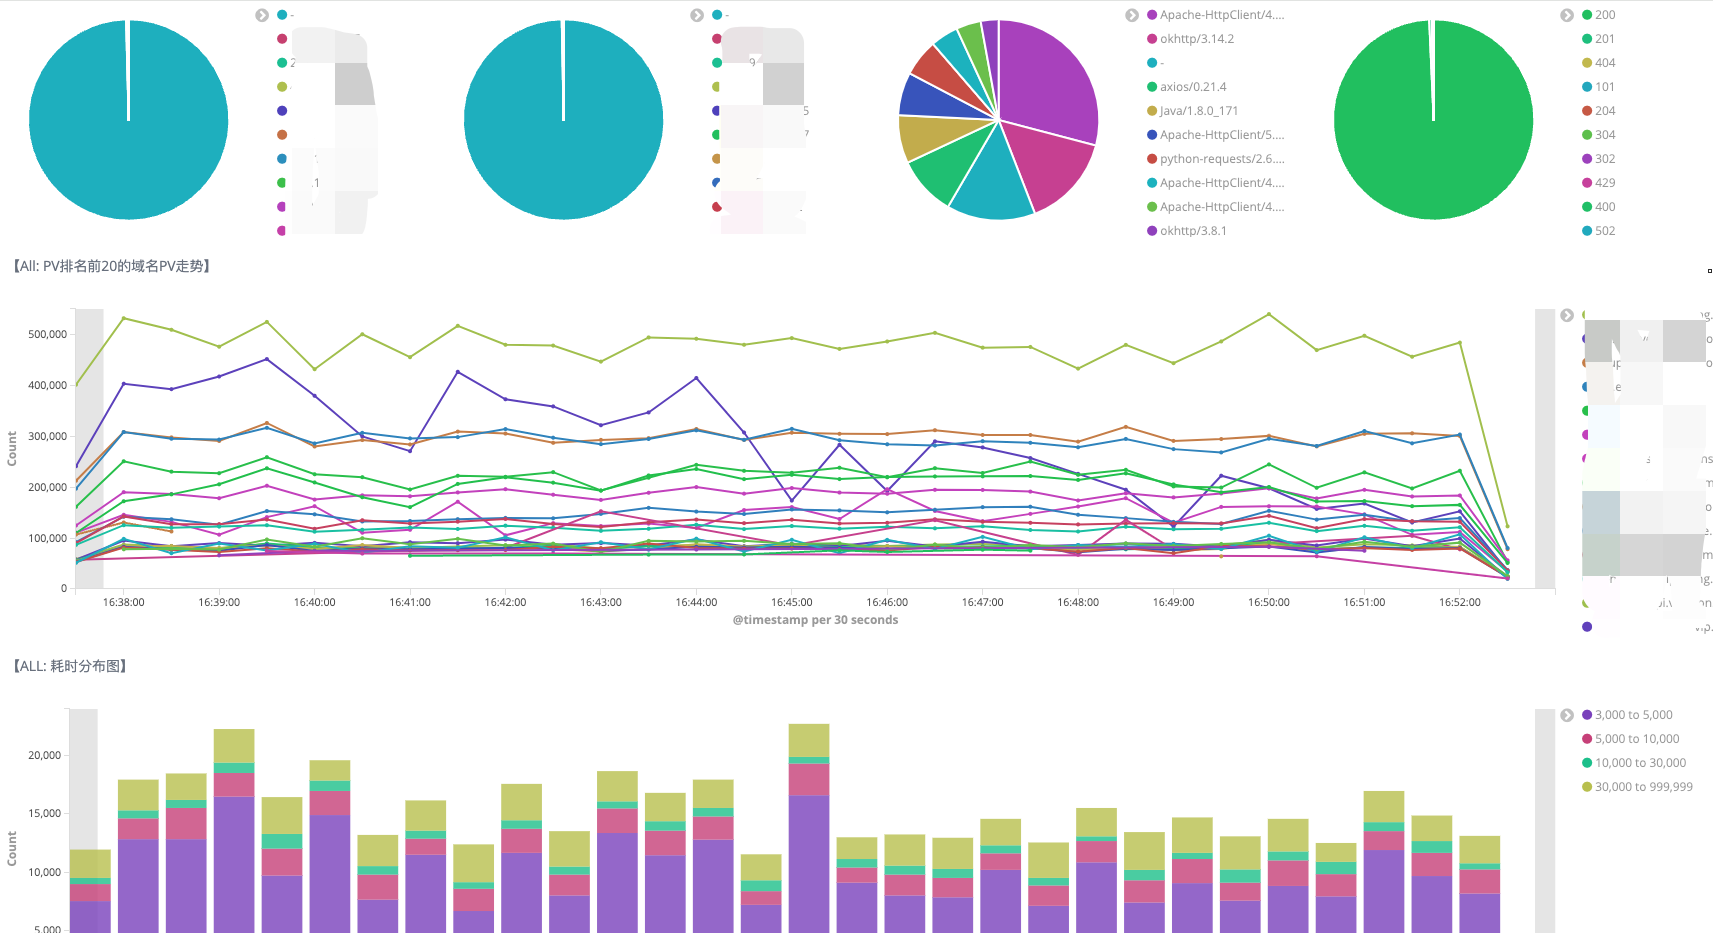
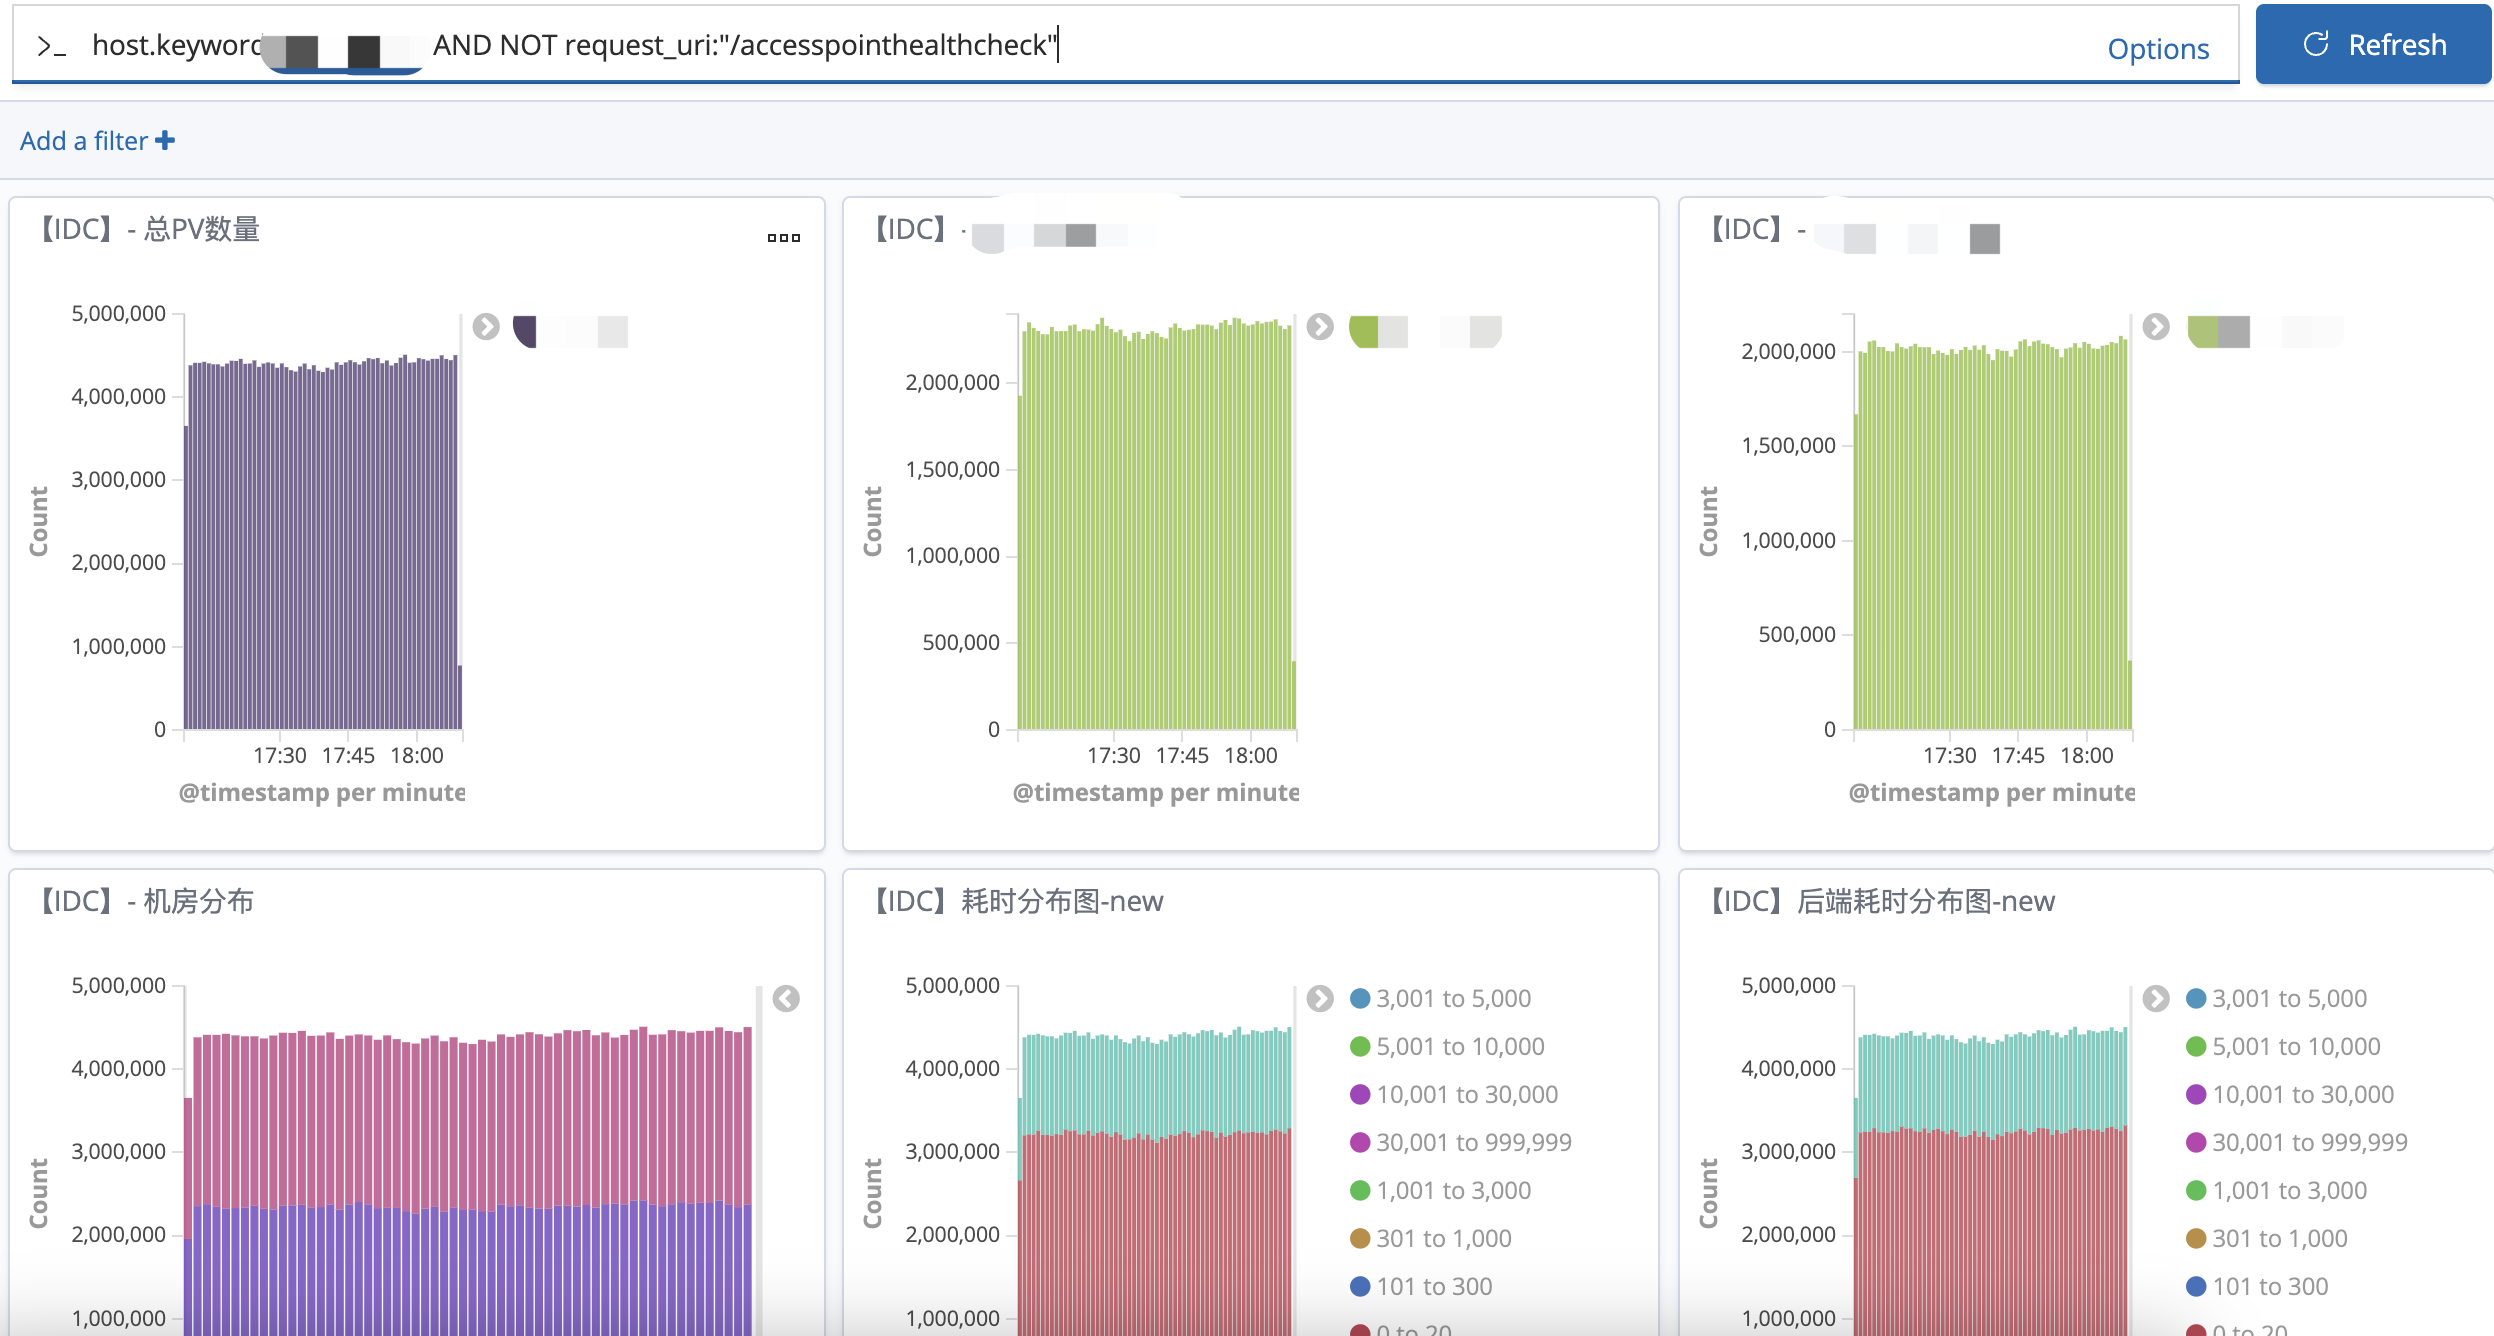
Use Cases
4 Benefits
As of now, by leveraging CKibana's core capabilities, we have successfully completed the full migration of all Nginx access logs and business-customized logs from Elasticsearch to Clickhouse, reducing our storage costs to below 30% of the original. Moreover, thanks to ClickHouse's distributed table capabilities, log queries remain unaffected even in the event of a single center failure, offering significant improvements over Elasticsearch in both cost and stability. We have also continued to use the flexible and powerful native Kibana as our visualization tool, allowing users to conveniently perform log queries and analyses using their familiar Kibana dashboard.
5 Finally
Our logging system's continuous evolution owes much to numerous outstanding open-source projects. Having proven stable and reliable internally, we're now excited to open-source the CKibana project. We also look forward to collaborating with the community to continuously enhance its functionality, fully leveraging the Kibana visualization and ClickHouse storage combination for log analysis.
Github Repo: https://github.com/TongchengOpenSource/ckibana/
We hope you find it useful and welcome your feedback. Thanks~