usercase
1、Accessing the native Kibana.
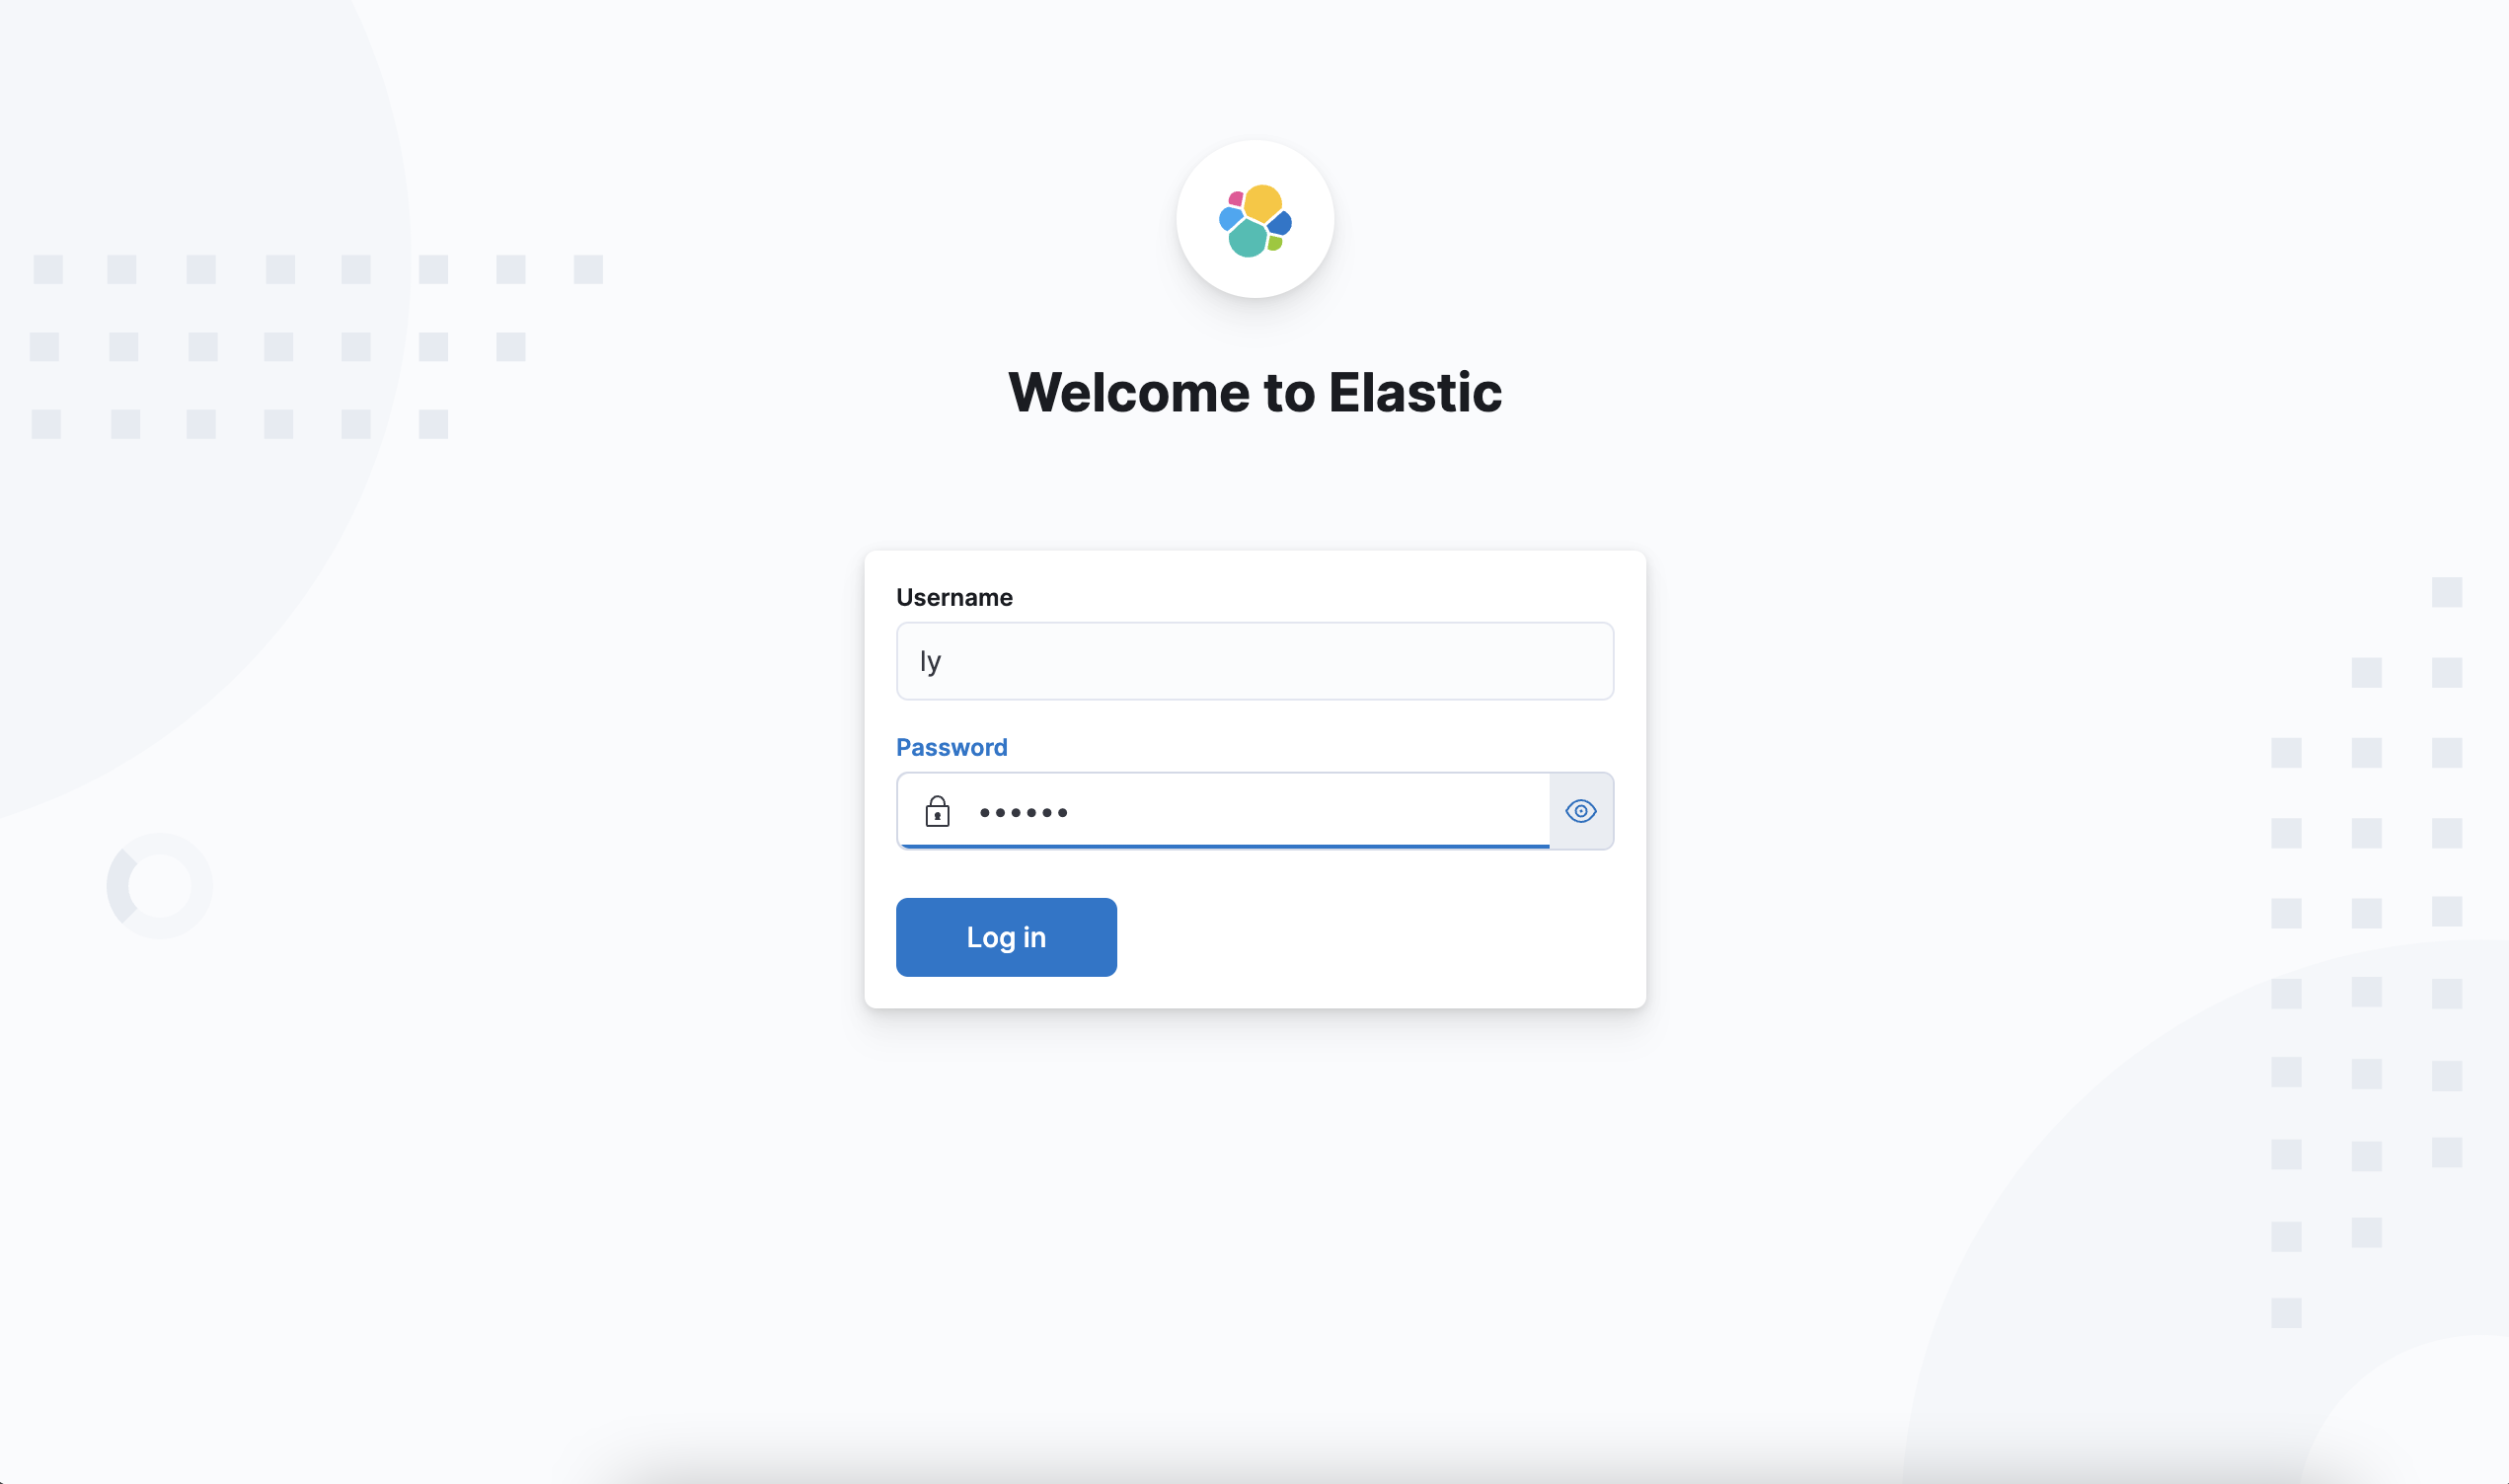
2、Changing Kibana configuration to connect to CKibana.

3、Configuration for starting CKibana
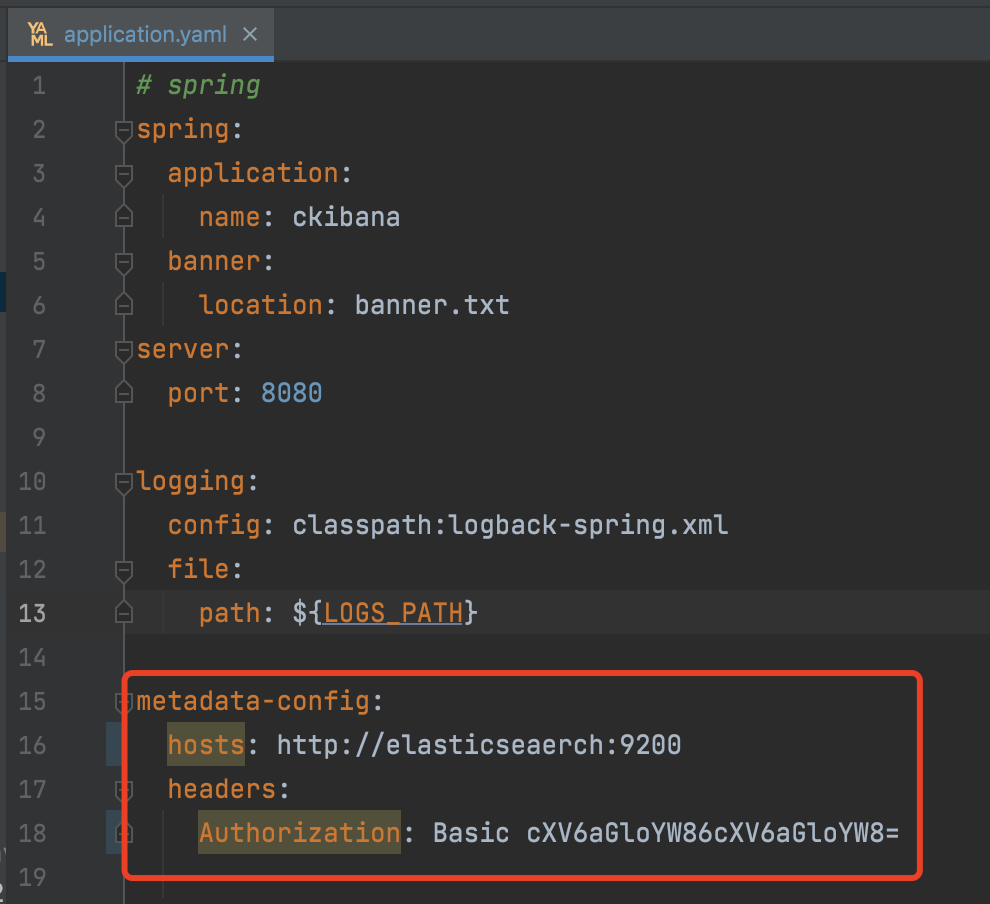
4、Configuring CKibana
Update ck connection information
curl --location --request POST 'localhost:8080/config/updateCk?url=ckUrl&user=default&pass=default&defaultCkDatabase=ops'
Update the index whitelist
curl --location --request POST 'localhost:8080/config/updateWhiteIndexList?list=ops_bjtlblog,other_index'
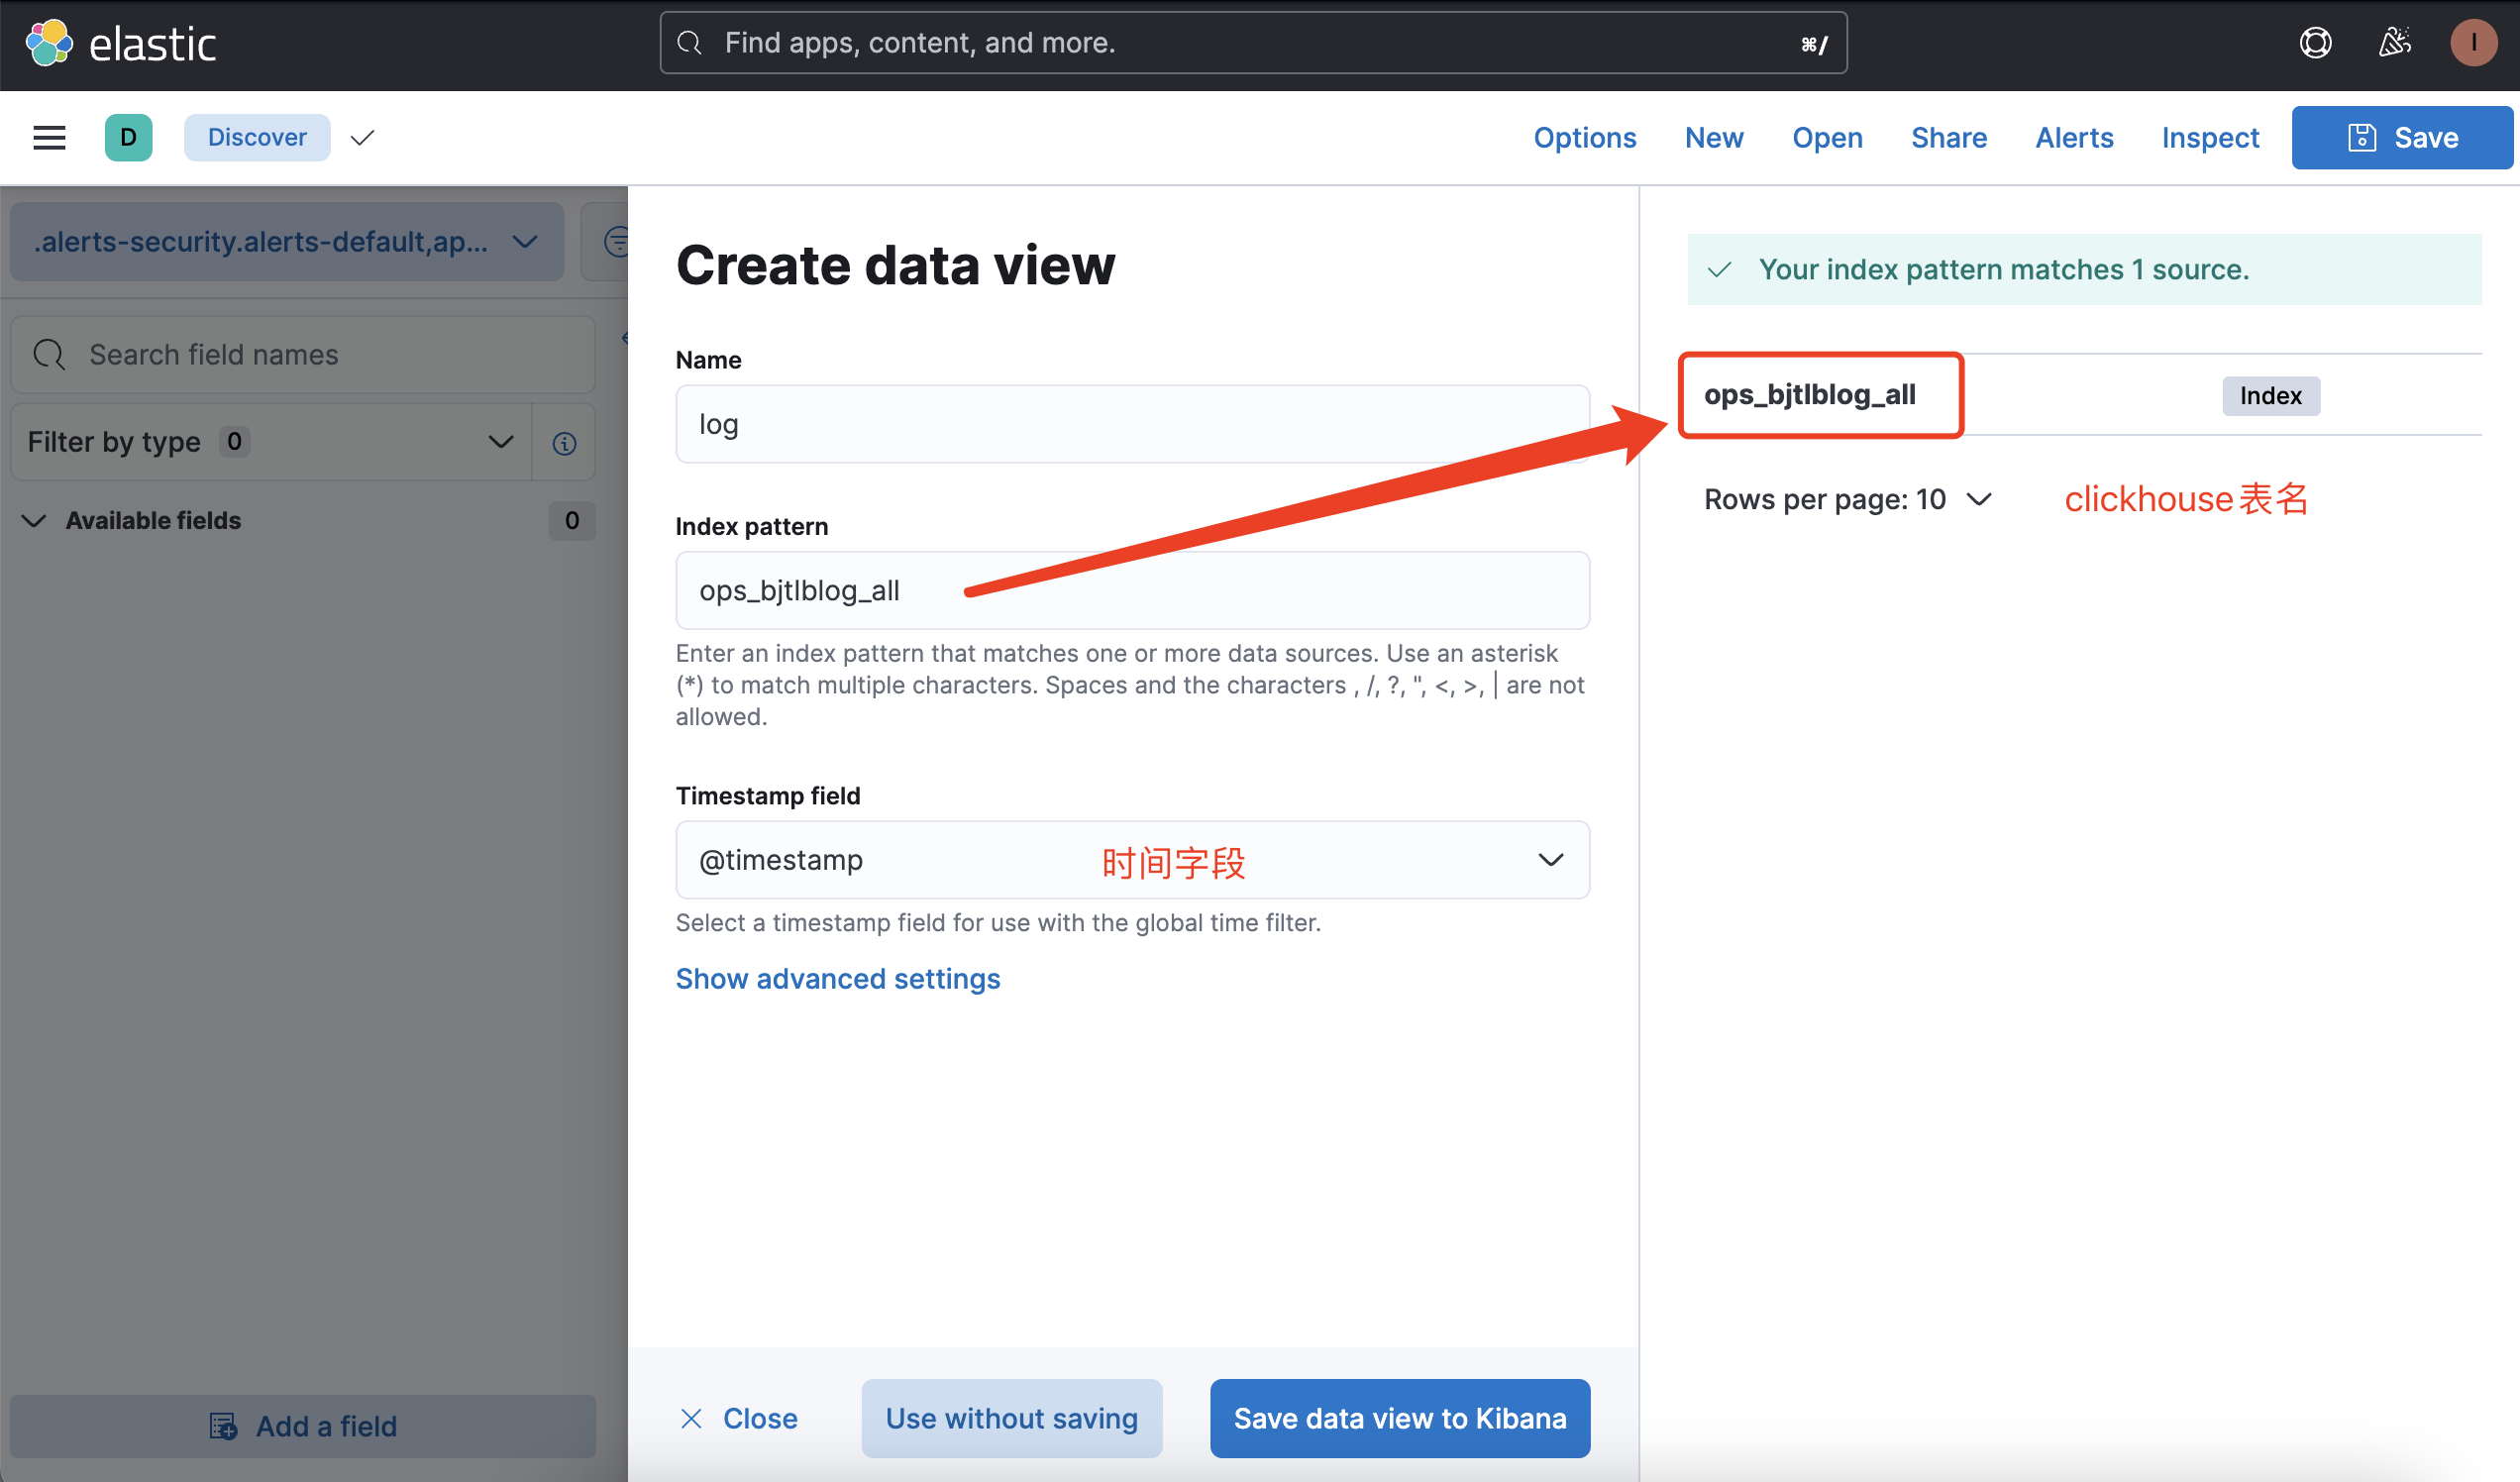
5、Configuring an index pattern.
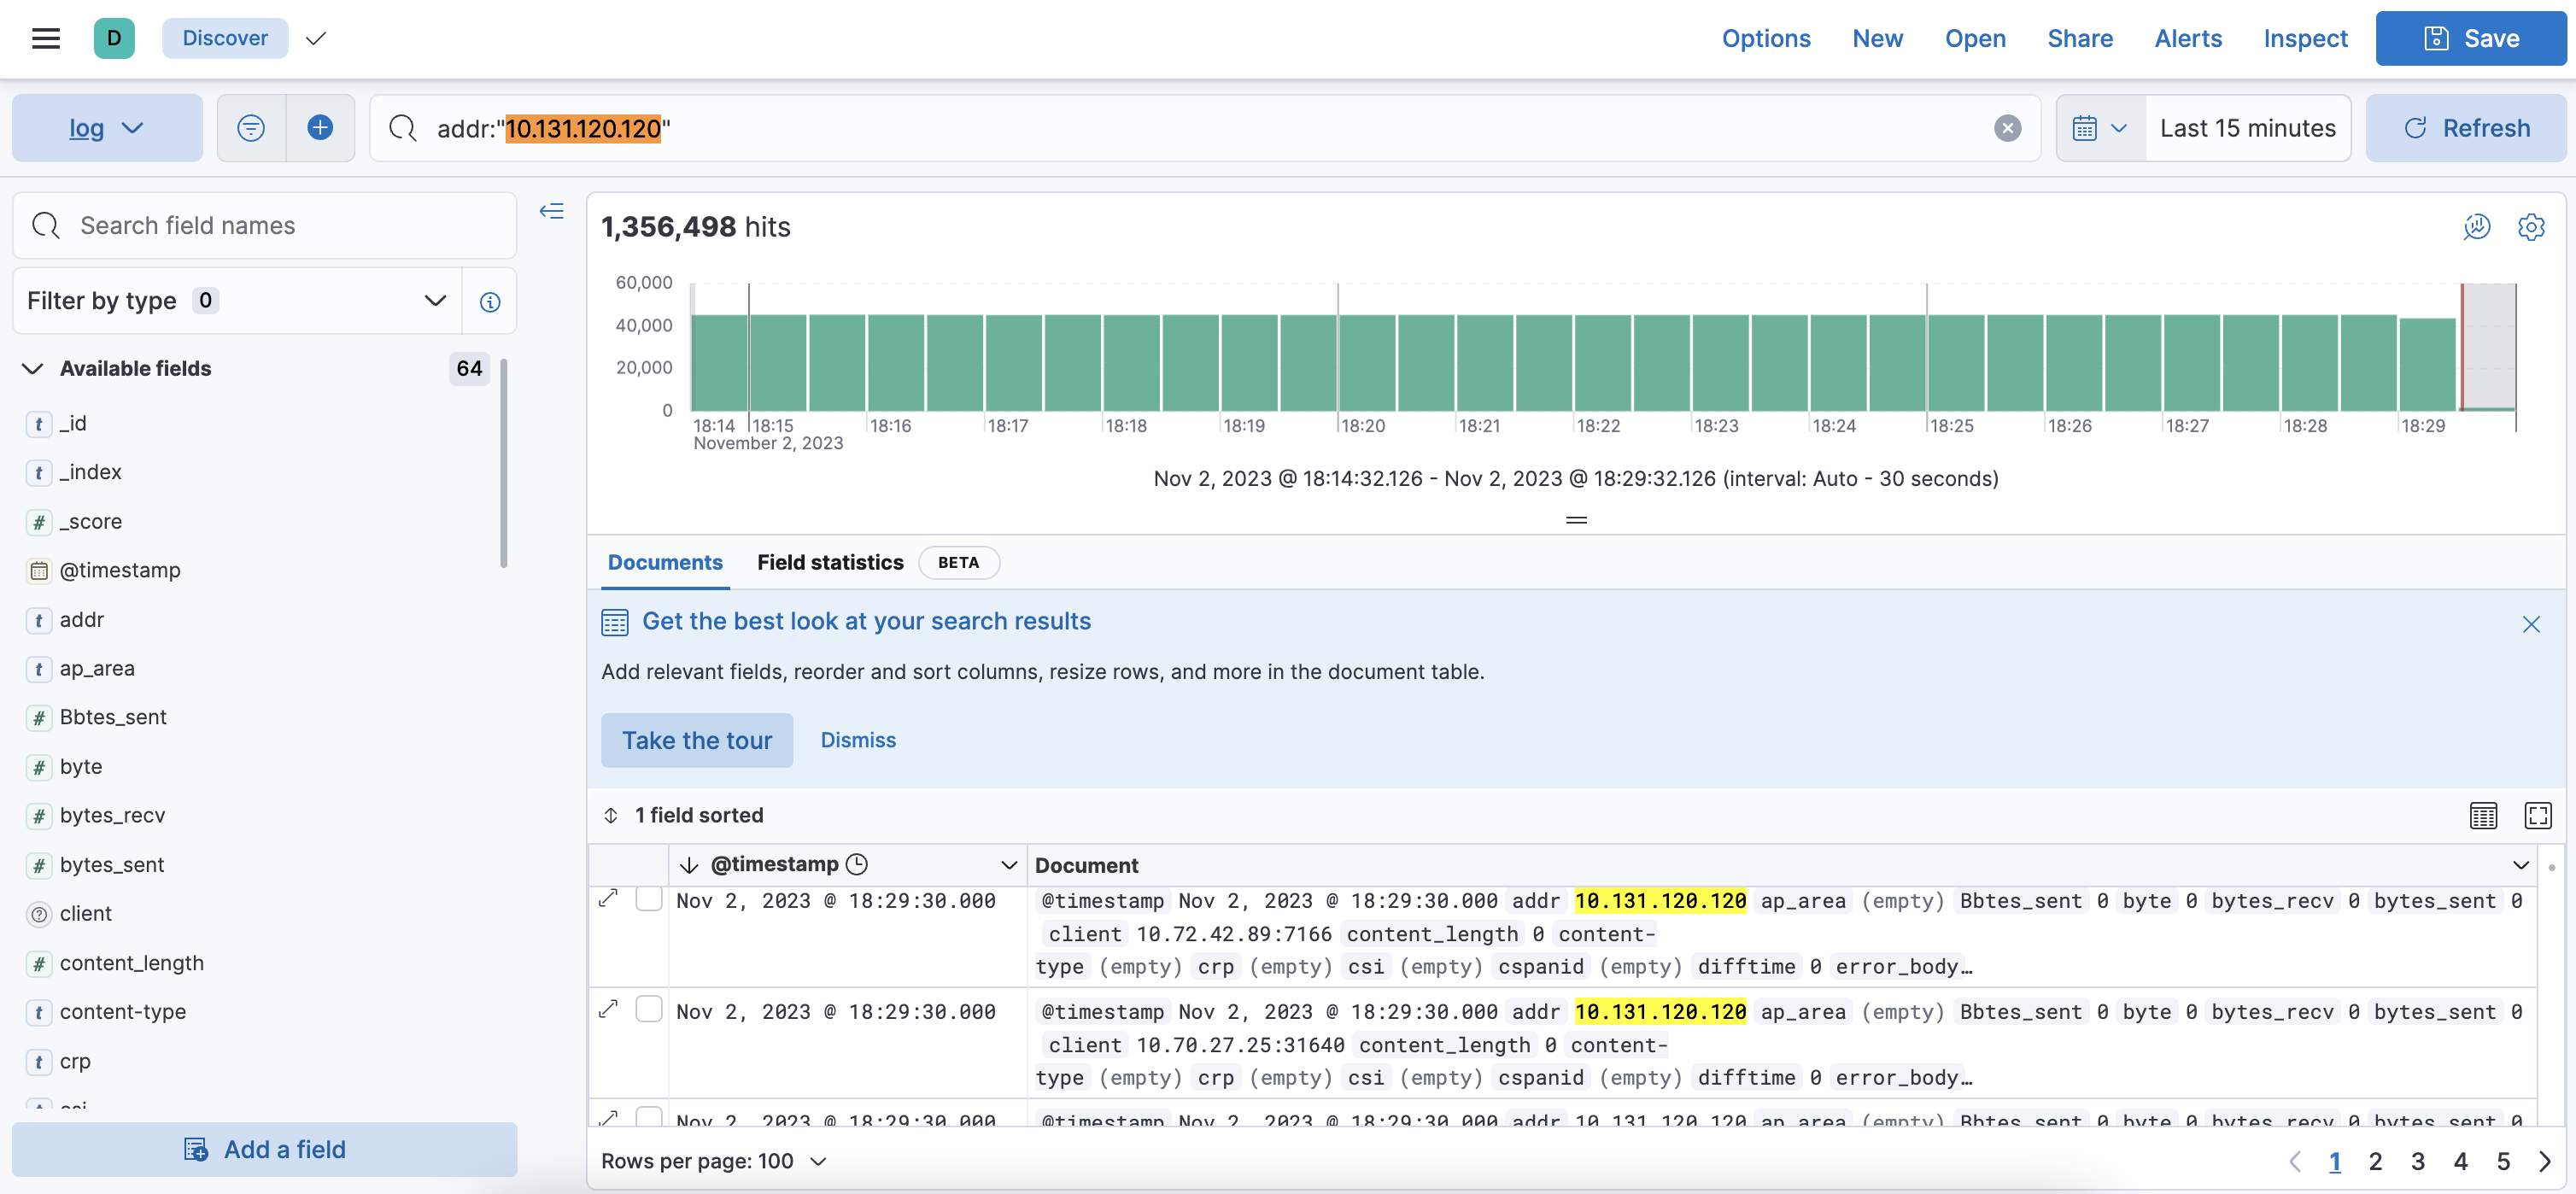
6、Performing a query
7、Enable Sampling
When the data volume is relatively large, turn on sampling can effectively improve the query performance. Note: If the sampling threshold is set too low, the restored trend graph will be different from the real one.
8、Enable query monitoring
You can monitor what syntaxes are being queried right now, and with the blacklist feature, you can effectively alleviate the problem of clickhouse resources being too high due to improper usage.
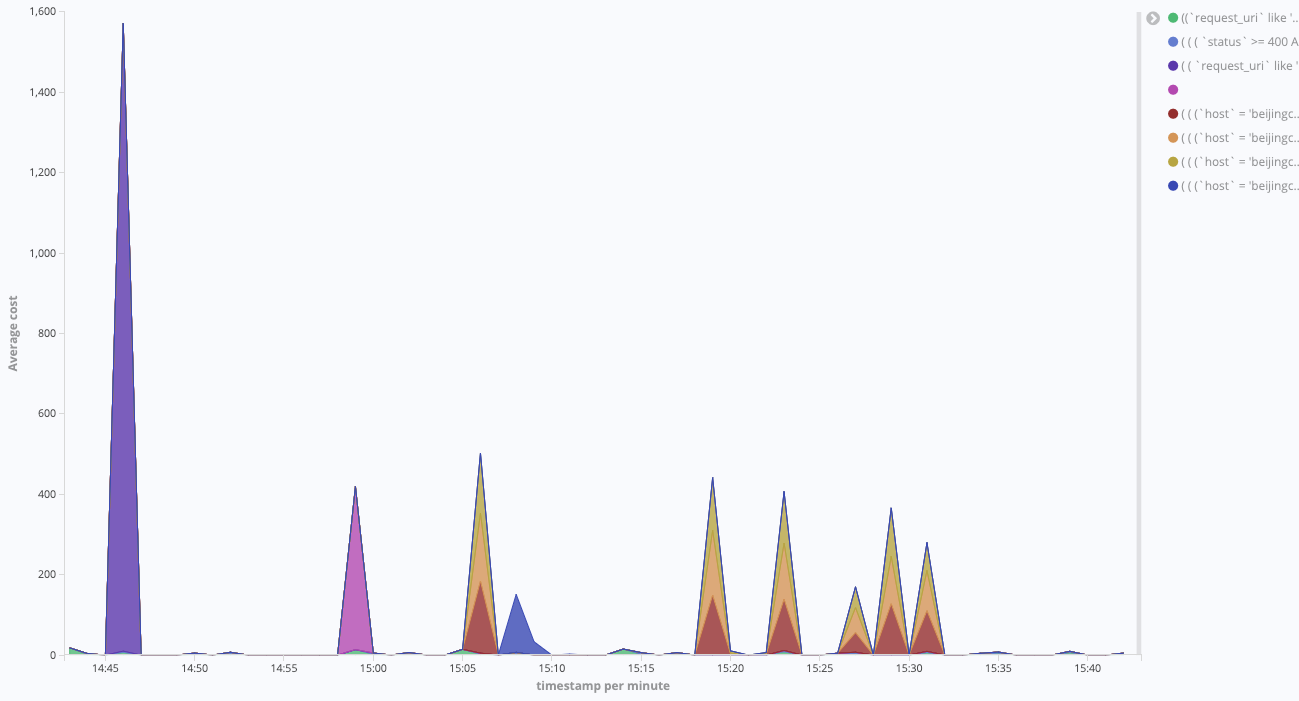
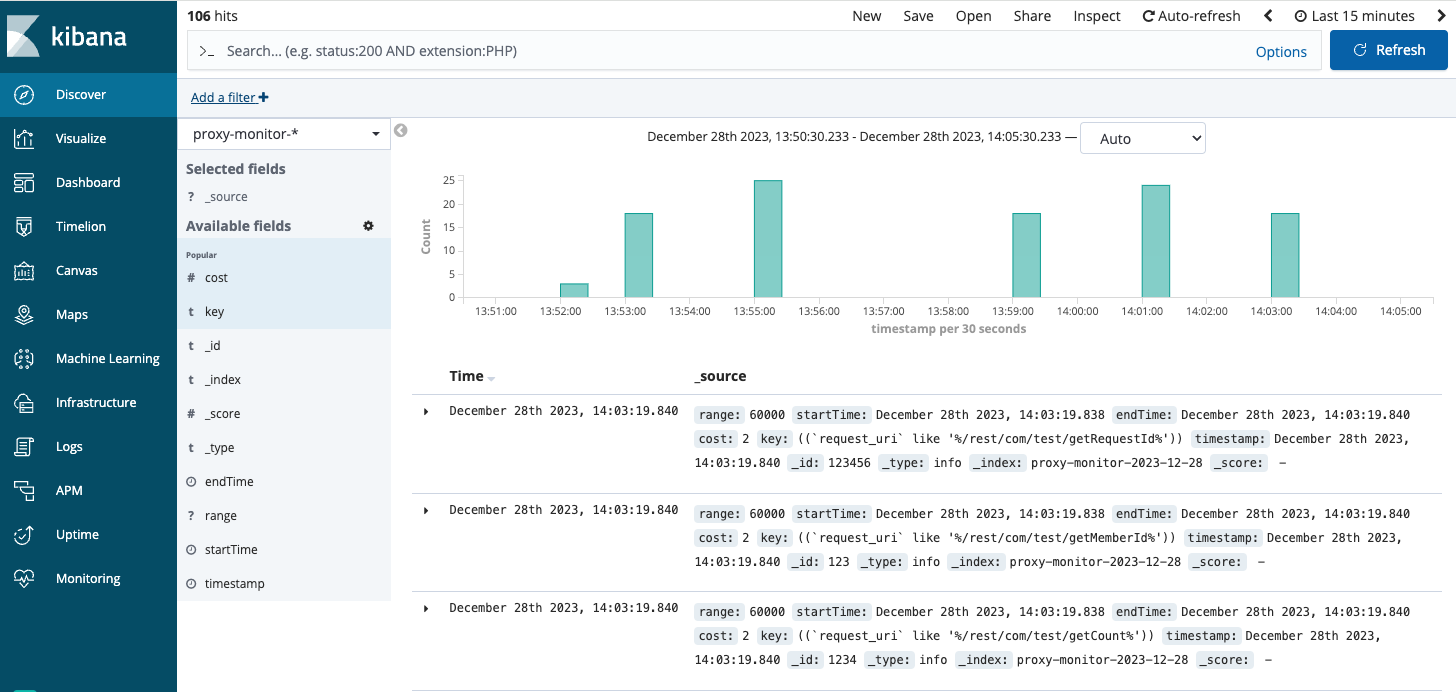 Using monitoring metrics, you can make charts and graphs to increase observability.
For example, the time consumed for each query:
9、Configure round time
You can round fetch the time, which works well with query caching to improve performance.
Common case, kibana inside a group of users in the query the same question, when the query conditions are highly consistent, configure round can be very good to ease the pressure of ClickHouse.
10、Enable query cache
When the query statement is consistent with the query time, the later query can hit the es cache very well, relieving the pressure on clickhouse.
query.useCache: true
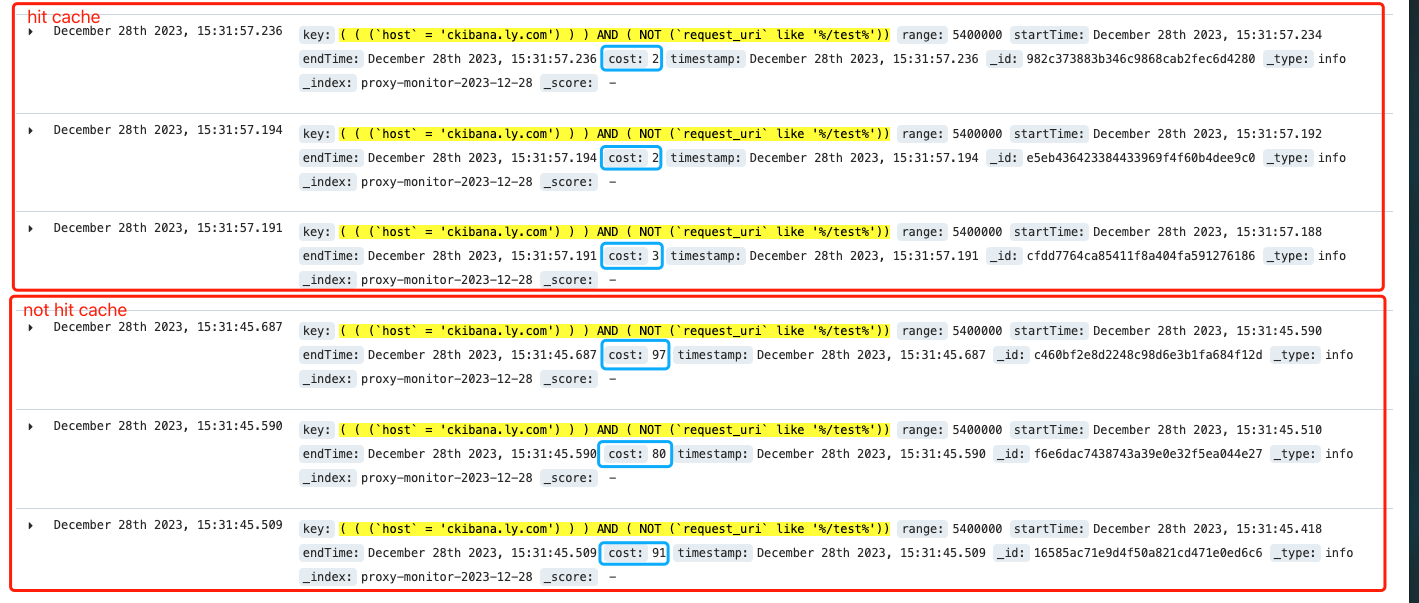 It can be seen that a hit to cache takes only 2ms, and 80ms in the case of no hit. This configuration is turned off by default, but we recommend turning it on as well.
Using Elasticsearch as the underlying storage medium, of course, the storage cost will be correspondingly higher, you need to maintain the proxy-cache index life cycle to regularly clean up the cold data.