troubleshooting
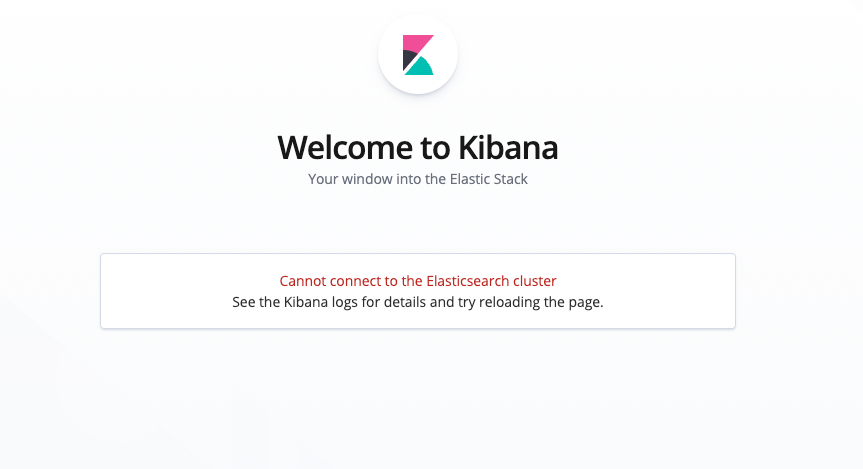
1、Cannot open Kibana.

The high probability of this error is that the initialization configuration is not correct.
1)Check if the metadata cluster in the configuration is correct
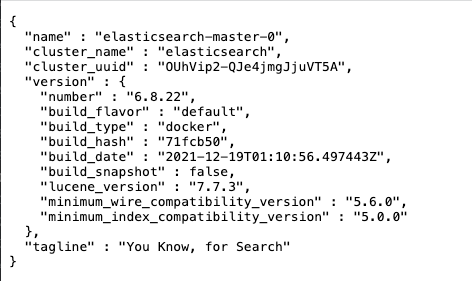
2)Check the elasticsearchHosts parameter in Kibana's configuration to see if the proxy address is correct and accessible. The following information should appear to indicate that the proxy configuration is correct

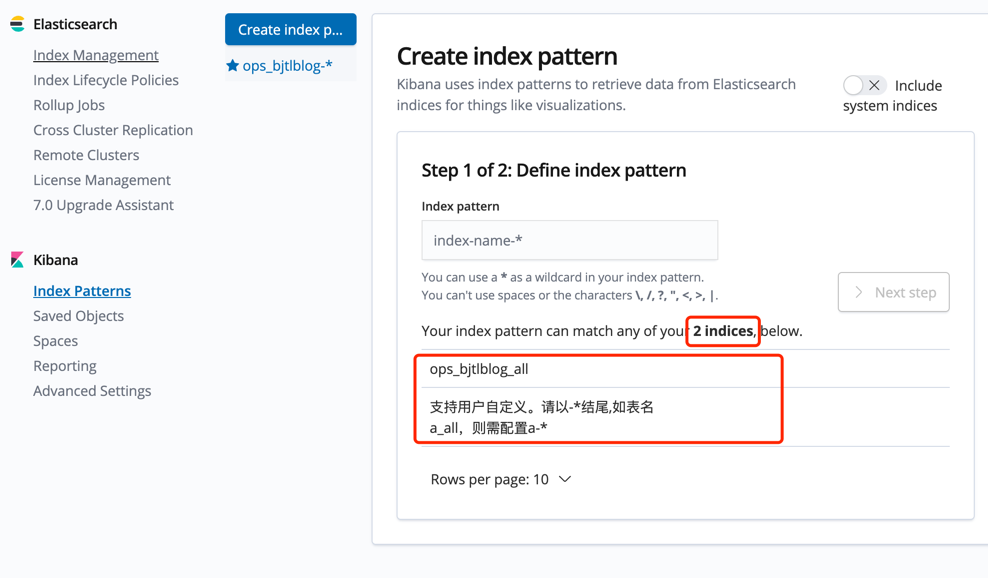
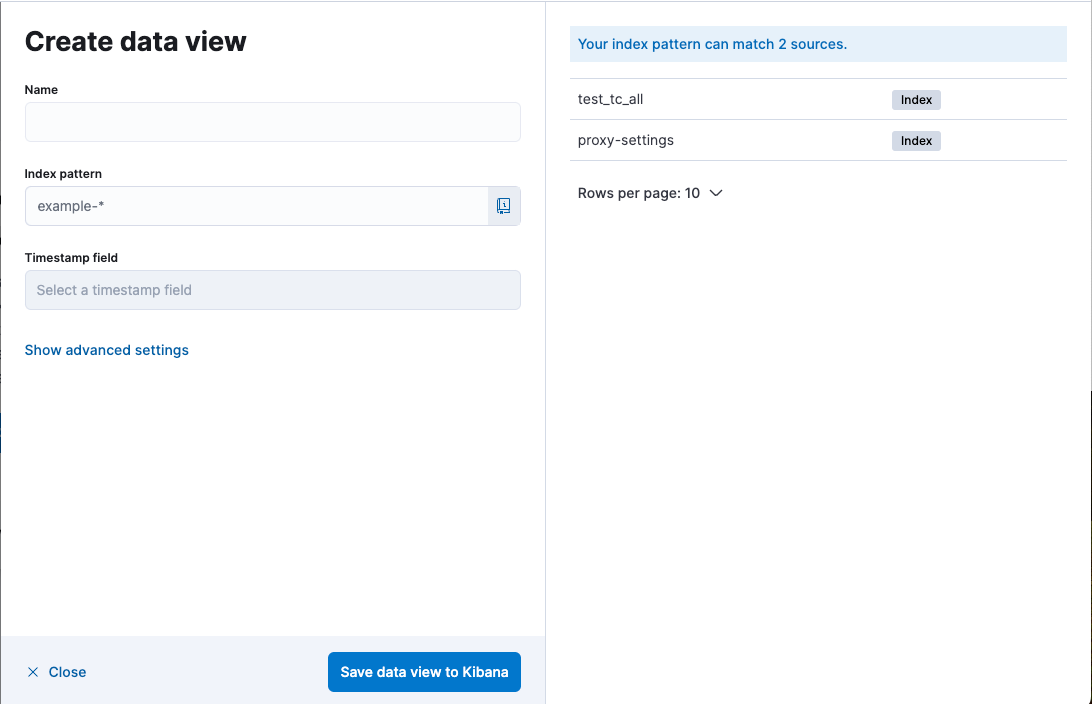
2、Unable to create an index pattern
As shown in the figure, the red box is when creating the index pattern. If the corresponding index pattern cannot be created.

The troubleshooting steps are as follows:
1)First determine whether a whitelist has been added to the table name, please refer to:api-docs Update the whitelist index interface
2)Determine whether the index pattern to be created is consistent with the ck table. The index pattern and the ck table name are an exact match
3)Check whether the configuration of the ClickHouse database is normal.
4)Using the SQL output from the logs, check whether the corresponding table can be queried in ClickHouse
After opening this interface, the output of the sql can be seen in CKibana's log, paste it into clickhouse and execute to view it.
[query][87ms] sql=SELECT name FROM system.tables WHERE database = 'ops'

3、When creating an index pattern, the time field cannot be selected.
The logic for matching the time field is:
1)Fields of type Date, such as DateTime64, will be recognized as time fields.
2)Alternatively, if the field name contains "time", such as (@timestamp UInt64), it will be recognized as a time field.
Either of these conditions will be satisfied and the field will be recognized as a time field. If the time field cannot be selected, you need to check whether the fields in the ClickHouse table meet the matching logic.
4、Unable to retrieve data.
You can see the specific SQL query being executed by opening the F12 console and inspecting the response.

5、High CPU usage in ClickHouse
Specific analysis can be done based on system.query_log in ClickHouse, with a focus on the two indicators read_rows and read_bytes
The processing plan includes:
**1)Find the corresponding SQL query and add it to the CKibana blacklist.
**2)Adjust the corresponding chart
6、User Privilege Error
[{"type":"security_exception","reason":"action [indices:data/write/bulk[s]] is unauthorized for user [elastic] with effective roles [superuser] on restricted indices [.kibana_analytics_8.11.3_001], this action is granted by the index privileges [create_doc,create,delete,index,write,all]"},{"type":"security_exception","reason":"action [indices:data/write/bulk[s]] is unauthorized for user [elastic] with effective roles [superuser] on restricted indices [.kibana_analytics_8.11.3_001],
When a similar error occurs, it means that the user lacks the following permissions, which can be solved by adding them in kibana:
kibana_systemkibana_adminsuperuser